Data Collection and Analysis
Learning Objectives
In this chapter you will learn:
- how to define different types of quantitative data
- the variety of analysis techniques for quantitative data
- descriptive statistics
- the difference between parametric and non-parametric tests
- how to define different types of qualitative data
- the variety of analysis techniques for qualitative data.
5.1 Quantitative Data
Methods of quantitative research are:
- experiments – carefully controlled in a lab.
- surveys – local/regional, or nationally, as a census.
- official statistics.
- naturally occurring data.
- social media
- auction sites
- online searches
- online map use
- Internet of Things (IoT)
- use of any digital device.
- customer loyalty cards… and so on.
Much of this type of data is captured passively; it is a by-product of what you are doing, and you are generally not even aware that what you are doing is being recorded or captured, and you do not have to do anything specifically for it to be recorded. These data sets are huge and comprehensive; they are created instantly and constantly updated. They are becoming increasingly cheap and easy to access in real-time.
5.2 Qualitative Data
Qualitative research is conducted using non-numeric statistical techniques. These data are words, pictures, symbols, artifacts, materials, etc., of relevance to a targeted social group. A major strength of qualitative research is the inductive analysis employed. Qualitative research aims to understand and interpret data using thick, detailed descriptions. Structure emerges from the data, patterns are connected to context (emic), and multiple interpretations are sought in developing theory.
Qualitative research has three core concepts:
Self-reflexivity
- This is your understanding of how your life experiences, views, and even your roles in life (student, employee, significant other, etc.) can impact your interactions and interpretations of other interactions or context.
- Your background encompasses your values and beliefs and determines and shapes your approach to conducting research.
- You are the research instrument, you are absorbing and interpreting the world you are in using observation, participation, and interviews.
- Your studies revolve around theory at every stage.
Context
- You immerse yourself in what is happening and try to make sense of it.
- The scene could be a business meeting, a community festival, an interview, or a community group, for example.
Thick description
- This relates back to context, it is how you, as a researcher, engage yourself in a culture, or a particular circumstance, only after you have absorbed all there is, can you move towards new impressive statements and theories.
- Meaning and thick contextual description co-exist; they are combined.
- Without a thick contextual description, what has occurred can be misinterpreted (Tracy, 2019).
Mixed Methods
Mixed methods research strategically integrates (or combines) quantitative and qualitative research to use the strengths of each and achieve greater insight into the topic at hand (McNabb, 2021). There are several advantages and disadvantages to mixed methods research design as detailed below.
Advantages of Mixed Methods Research Designs
- Combining numbers, graphics (images, symbols, pictures), and narrative (written and recorded) can improve the interpretation and comprehension of the topic which is being studied
- Combining qualitative and quantitative research methods allows the researcher(s) to consider a greater number of research problems in more detail
- Where there may be weaknesses in one method these can be overcome by using multiple methods
- Mixed methods research design can strengthen the validity of research findings via triangulation
- The additional thematic focus mixed methods research design can bring to a study can be very beneficial.
Disadvantages of Mixed Methods Research Designs
- A mixed methods research design has the potential to be highly complex, requiring multiple researchers.
- Mixed methodology requires extensive methodological skills.
- Mixed methods designs can be time-consuming and costly.
- Those funding research may be unwilling to support a mixed methods approach, which they may be unfamiliar with.
- Researchers who are unfamiliar with mixed methods research may struggle with having, or obtaining, the necessary skills to provide accurate results for their study (McNabb, 2021).
Why use Mixed Methods Research Design?
Mixed methods research designs are used for the following reasons:
- Triangulation – confirms or reinforces the validity of the findings from different points.
- Complementarity – complements, expands, illustrates, clarifies, or enhances the understanding emerging from research data analysis.
- Reinforcement – application of the findings of one method to help inform or expand the findings of another design.
- Conversion – reshaping or reforming the research problem(s) by resolving any paradoxes or contradictions that emerged when using a single method.
- Expansion – building on the scope of the research by approaching elements of the study from different points of view.
The following are different types of mixed methods research designs.
Exploratory Mixed Methods is a Two-Phase or Sequential Approach
- First, a qualitative approach generates insights from a small sample size.
- Next, a quantitative approach is used to obtain a large sample size.
Exploratory mixed methods is usually undertaken by qualitative researchers with a qualitative topic/problem, when they struggle to identify the most pressing issues associated with the topic/problem and:
- there are no time constraints or funding constraints
- the research design is sequential
- qualitative analysis throws up questions that can only be answered with quantitative data.
Explanatory or Causal Mixed Methods
- uses theory in the form of hypotheses
- used to gain an understanding of the topic/problem
- may use quantitative experiments – control group and experimental group
- randomly selects/appoints participants to control and experimental groups
- controls all variables other than those being tested.
First, measure/describe all participants. Next, apply the treatment to the experimental group. Withhold the treatment or provide a placebo to the control group.
Where the design of the research, for example, implements in the first instance, a quantitative experiment, the results can be used to identify key variables/themes for the second part of the study. The identified variables/themes are then used in a qualitative study which can provide richer, thicker descriptions to ‘flesh out’ the quantitative results (McNabb, 2021).
Sequence Variations
Quantitative and qualitative data are collected, analysed, and results interpreted in ‘parallel’, but results may focus on either type.
- Quantitative and qualitative data are collected and analysed separately. Results are combined in the discussion of what has been found.
- One type of data is collected and analysed before the other, the process is sequential.
Parallel Designs
- Data are analysed separately.
- All information is kept separate until after the data are analysed.
- Both quantitative and qualitative data sets must be complete and analysed separately prior to comparing or integrating results.
Coincidental or Concurrent Designs
- Qualitative and quantitative data are collected.
- When data are analysed, relevant qualitative data is recorded and analysed quantitatively.
- Effect size of identified themes can be utilised.
Sequential Mixed Analysis Designs
- Begin by collecting qualitative data about the target population who have been identified with several similar characteristics.
- Define a distinct group using the qualitative data.
- Use a quantitative process and analysis to compare the groups.
Analysis Emphases
- Mixed methods data analysis has 3 approaches with distinct emphasis on data methods according to the research focus.
- Qualitative – quantitative (QUAL-Quant) design:
- Here, the emphasis is placed on the qualitative collection and analysis of data to begin with.
- More weight is given to the qualitative results.
- Quantitative – qualitative (QUANT-Qual) design:
- It is generally undertaken after an initial exploratory research where the sample size is small.
- Data are collected and analysed quantitatively.
- Quantitative analysis is conducted on qualitative data with the aim to provide deeper understanding of quantitative results.
- QUAL-QUANT or QUANT-QUALT design:
- Qualitative and quantitative data are obtained at the same time.
- When analysed, both sets of data are given equal weighting.
- Discussion does not focus on one set of results over the other (McNabb, 2021).
5.3 Quantitative Data Analysis
Defining types of quantitative data
Quantitative data are made up of variables that represent amounts, the number of things, for example, the number of fish in Lake Tinaroo (Far North Queensland).
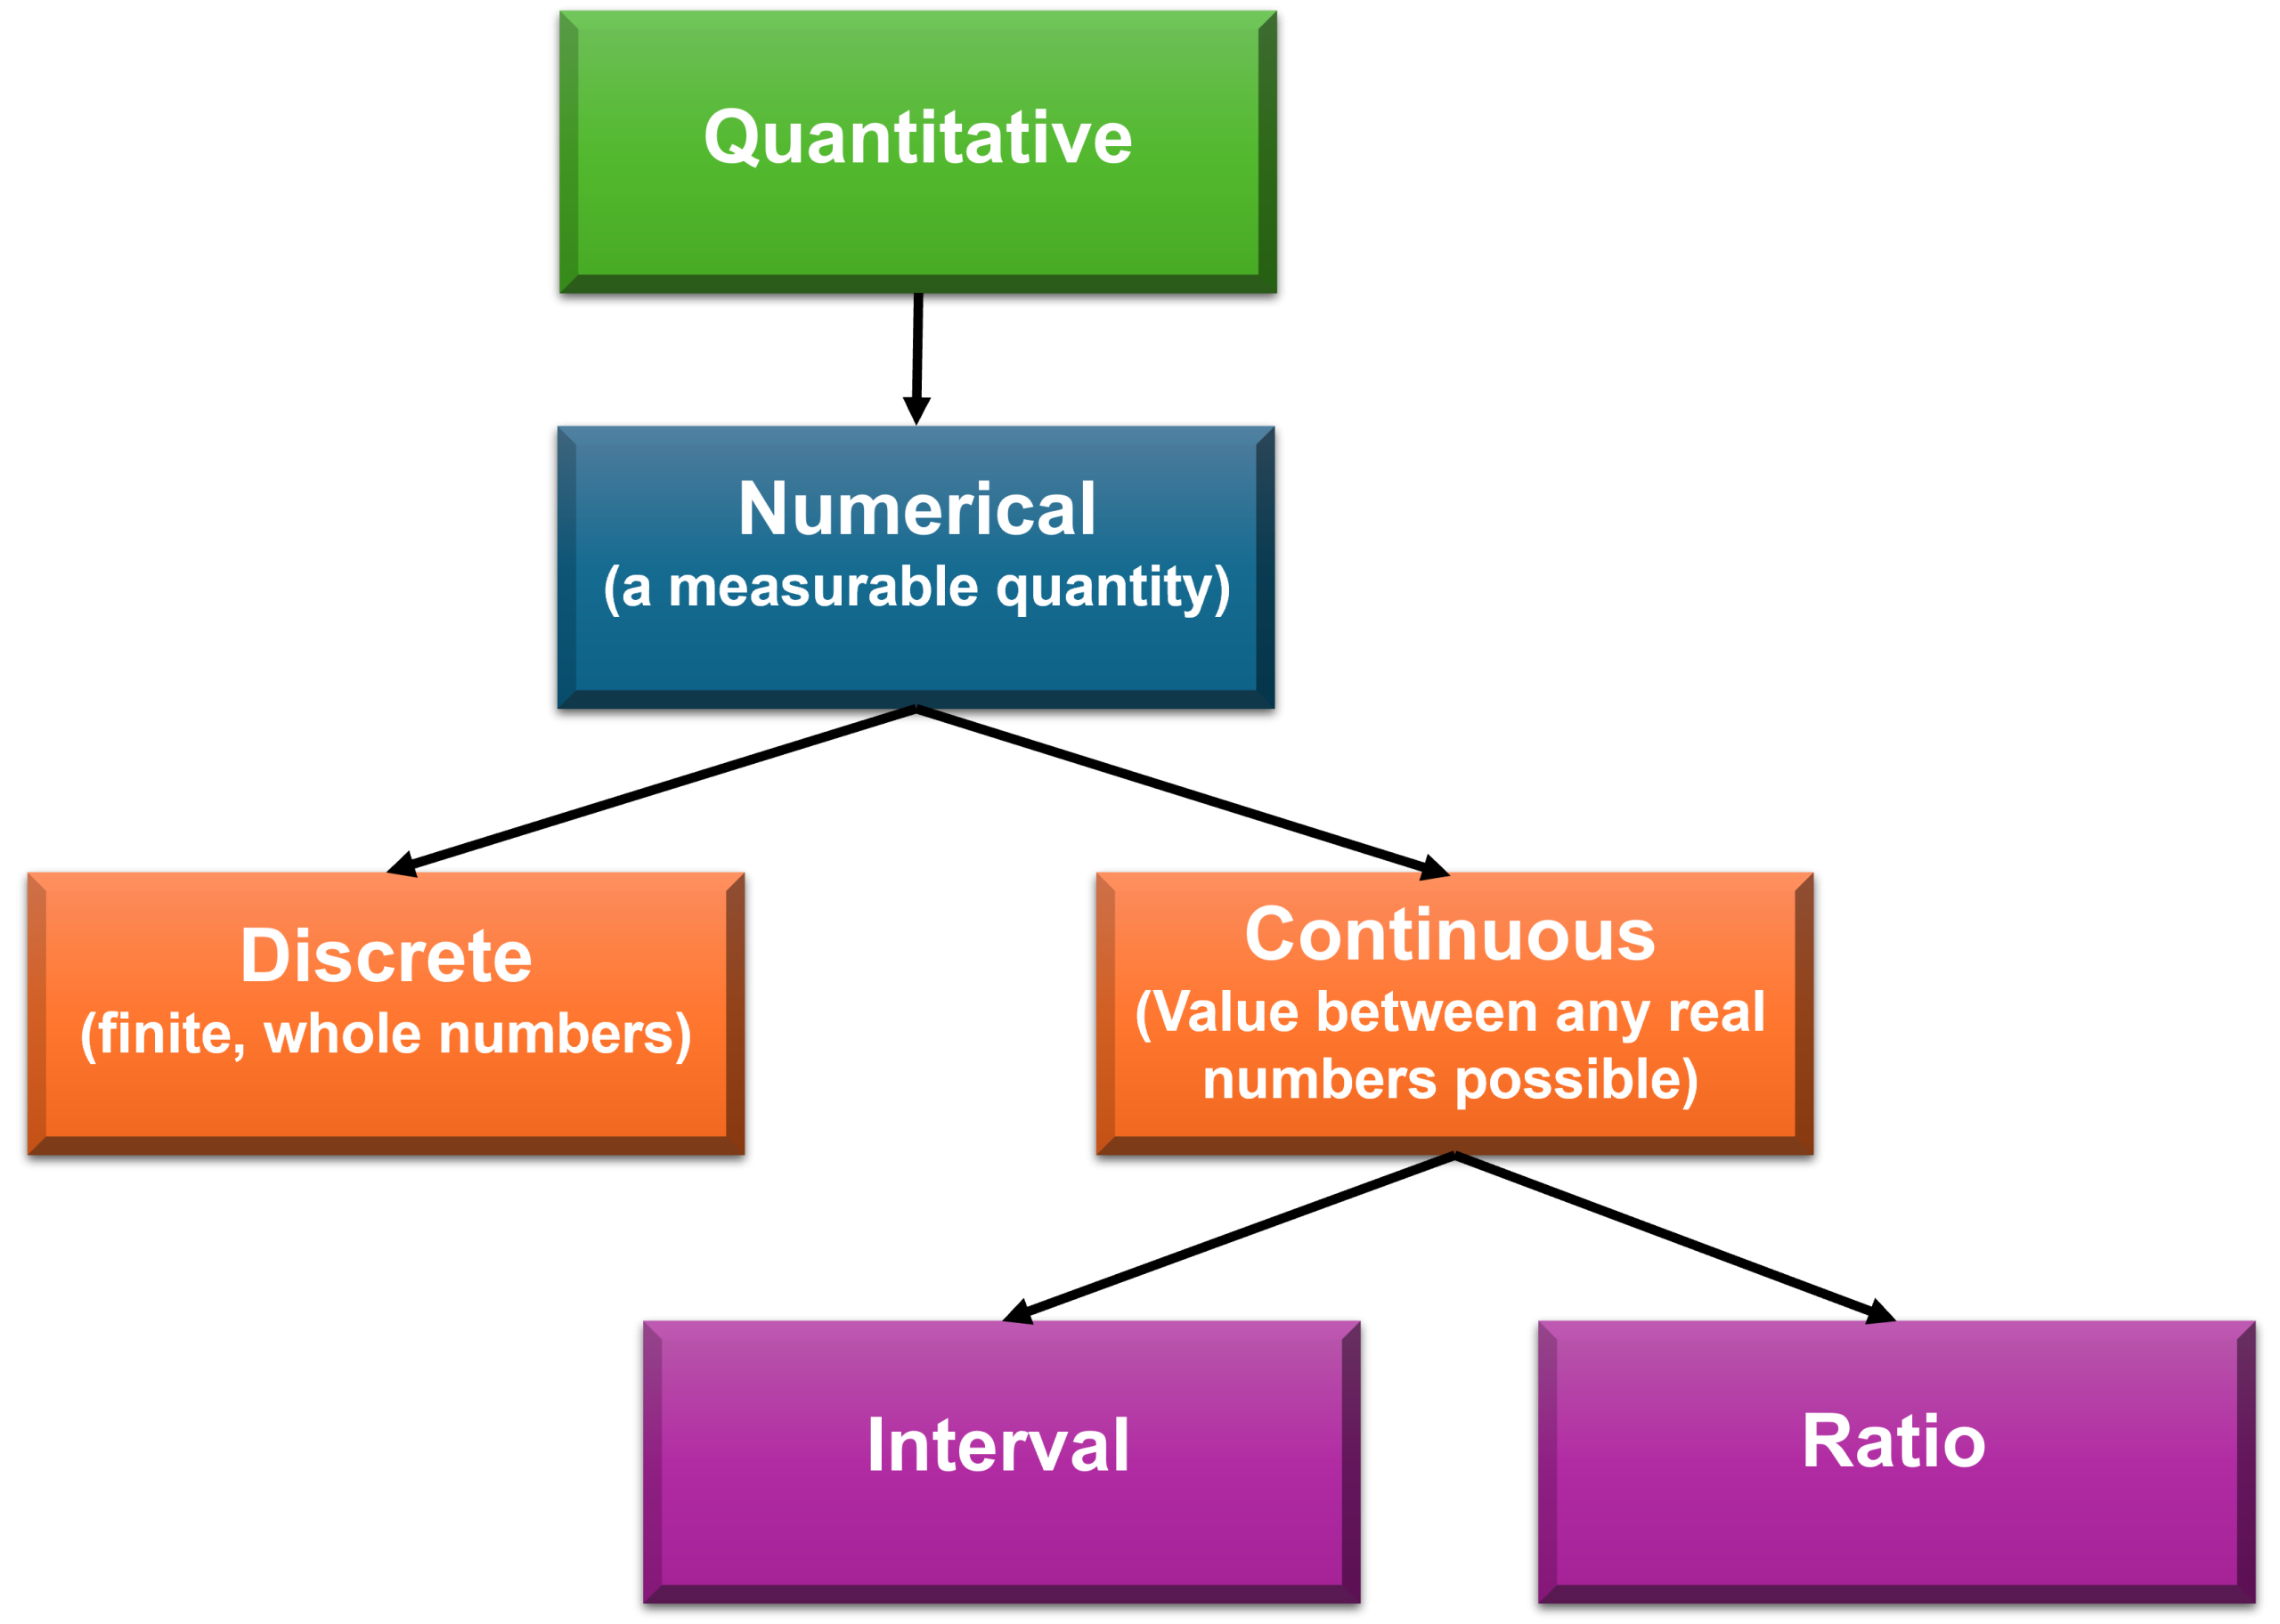
Discrete Data (can be counted)
- Discrete data (Figure 5.1) contains only whole numbers, they can only take specific numeric values as they are finite. As the number of possibilities is finite, it is countable.
- For example, the number of pets a person owns, you cannot have 1.25 pets; you would have 1 or 2 pets.
Continuous Data (can be measured)
- Values are not countable; there are an infinite number of possibilities.
- Interval data
- Has a relative distance between numbers on a scale but does not have an absolute zero.
- Zero is an arbitrary point, for example, the temperature scale. Celsius has zero as the temperature at which water freezes at normal atmospheric pressure. With Fahrenheit zero is the temperature at which a mixture of ice, water, and ammonium chloride freezes.
- As zero is arbitrary, any attempt at using ratios of the scale values do not offer any meaning.
- Ratio data
- Ratio scales have a true zero.
- For example, the Kelvin temperature scale starts at absolute zero, there is no motion and no heat.
- Therefore, 0 on a scale measuring Kelvin temperature is the absence of the variable being measured. This also means that the differences in points on the scale are meaningful; 300 Kelvin is twice as hot as 150 Kelvin.
Analysing the Data
Quantitative data analysis is analysing numbers-based data or data that can easily be converted to numbers without losing any meaning. There are several software programs that enable quantitative data analysis, such as SPSS (including AMOS), R, SAS, Stata, and Excel. Excel requires the Data Analysis ToolPak to be installed. For instructions on how to do this, click here.
Selecting Quantitative Data Analysis Tools
Descriptive Statistics
Descriptive statistics are used to explore, summarise, and describe data collected. Descriptive statistics are useful in making some general observations about the data, for example, age range, mean age, and gender numbers. For video instructions on how to use descriptive statistics in Excel click here.
Histogram
To check if the data are normally distributed, a histogram is used. When the variable is continuous, such as age or salary, the category width (range) is determined manually. This is generally simple for age by going up in 10-year steps. The minimum and maximum age, with the number of respondents, provides an indication of starting and finishing ranges. For video instructions on creating histograms in Excel click here.
Histogram Types
There are three main types of histograms:
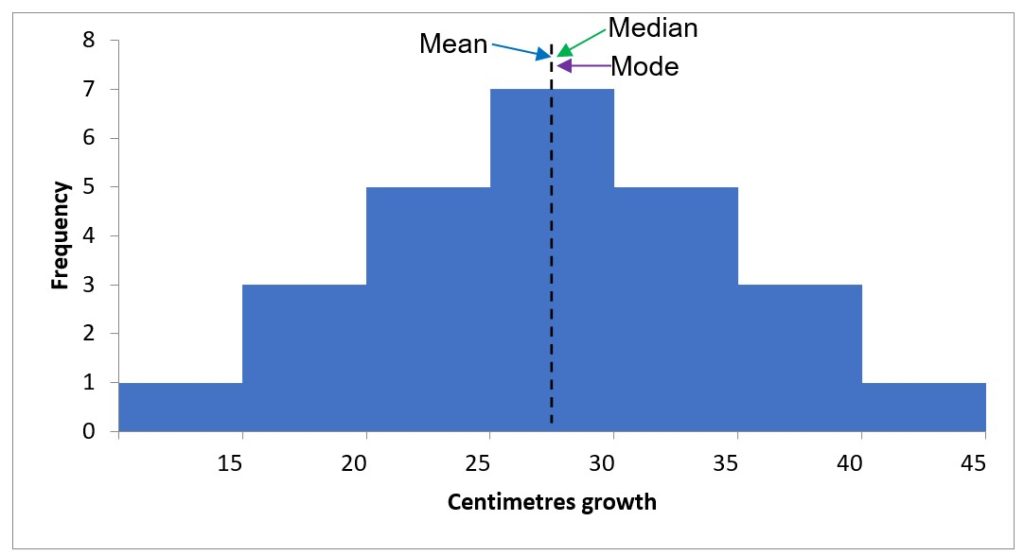
- Normally distributed data display as a bell-shaped curve in a histogram. This means the data passes the normality test for parametric data analysis (Figure 5.2).
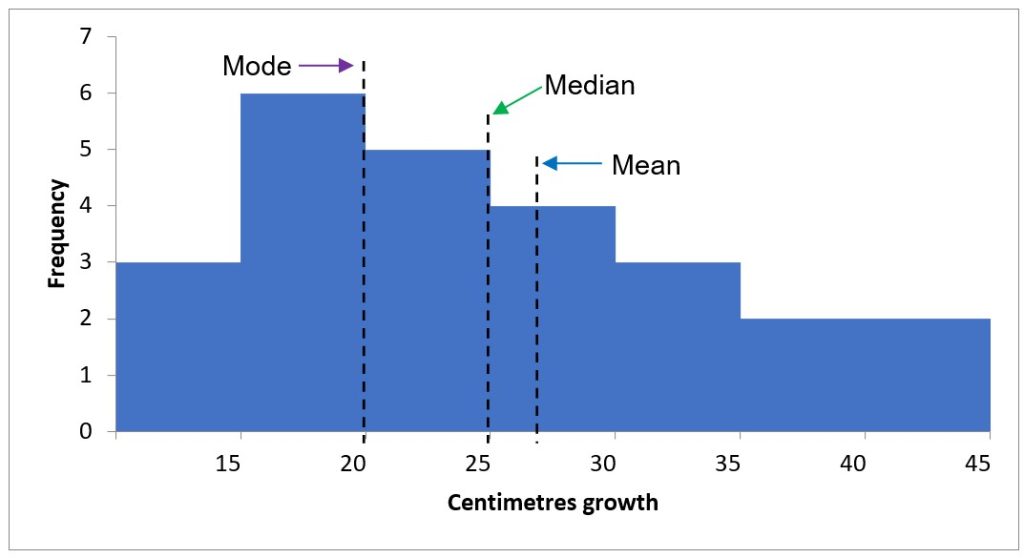
- Positively skewed data have a ‘long tail’ to the right in a histogram. This means that the data do not pass the test of normality and are not suitable for parametric analysis (Figure 5.3)
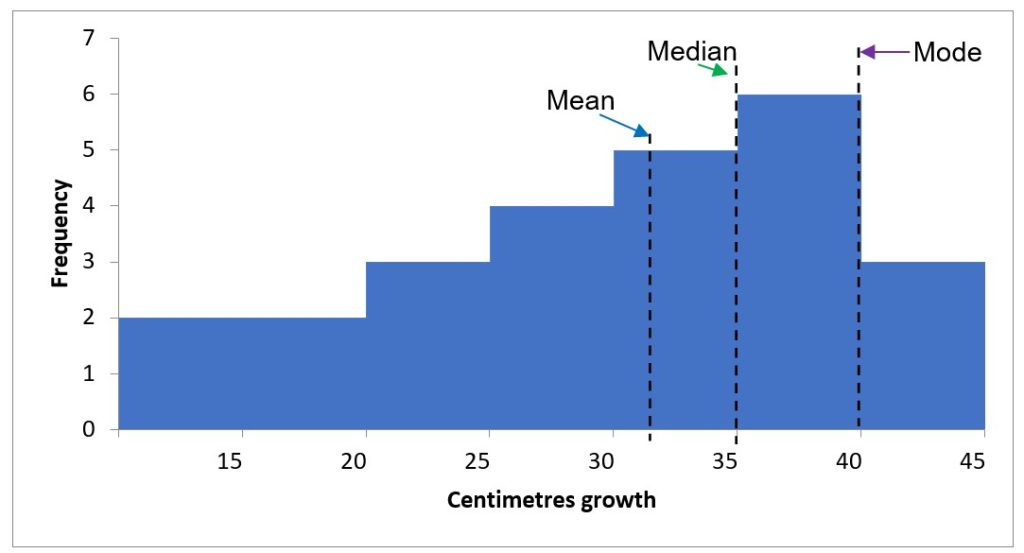
- Negatively skewed data have a ‘long tail’ to the left in a histogram. This means that the data do not pass the test of normality and are not suitable for parametric analysis (Figure 5.4).
- Another way of checking for normality is to look at your descriptive statistics output table (Table 5.1). Look for the kurtosis and the skewness figures. If Kurtosis is between -.73 and +.73 the data is acceptable, if the skewness is between -.36 and +.36 the data is acceptable. Always use it in combination with the histogram to check the normality of data.
Table 5.1 Descriptive statistics output
| Mean | 27.40 |
| Standard error | 1.81 |
| Median | 25.00 |
| Mode | 20.00 |
| Standard deviation | 9.03 |
| Sample variance | 81.50 |
| Kurtosis | -0.66 |
| Skewness | 0.50 |
| Range | 30.00 |
| Miniumum | 15.00 |
| Maximum | 45.00 |
| Sum | 685.00 |
| Count | 25.00 |
Pivot Table
A Pivot Table is used to compare multiple categorical variables. For video instructions on creating a pivot table in Excel, click here.
For video instructions on creating a pivot table chart in Excel, click here.
Scatter Plot
A Scatter Plot can be used to look at the relationship between two variables. For video instructions on creating a scatterplot in Excel, click here.
Chi-Square for Nominal or Ordinal Data
A Chi-Square test is conducted to determine if the distribution of the number of items in each category is the same as the expected values. If values are below 5 (<5), or the total of the values is below 50, Chi-Square is not generally used. For video instructions on how to use Chi-Square in Excel, click here.
Parametric and Non-Parametric Tests
When deciding on what type of data analysis to conduct, you need to know whether to use a Parametric or Non-Parametric test. Each parametric test has several assumptions that must be met, the main one being that data are normally distributed. If data are not normally distributed, the equivalent non-parametric test should be used (Table 5.2).
Table 5.2. Common parametric and non-parametric tests, use, and examples
| Parametric Test | Non-Parametric Test | Test | Example |
| Independent groups t-test | Mann-Whitney U test | Used to determine if 2 groups are significantly different from each other on the variable of interest (continuous). | Is income determined by where you live (city or rural)? |
| Paired t-test | Wilcoxon signed-rank test | The same participants perform under each level of the independent variable (pre-test and post-test). | Examine student test results before (pretest) and after (post-test) a unit of study. |
| One-way between-groups analysis of variance ANOVA | Kruskal-Wallis test | Examines possible differences between 2 or more groups. | Is there a difference in crop yield if a farmer uses fertiliser A, B, or C? |
| Pearson’s r (Pearson’s correlation coefficient) | Spearman’s rank-order correlation (Spearman’s rho) | Estimate the degree of association between 2 variables. | Does the number of hours a person spends on social media affect the number of hours they sleep at night? |
Parametric Tests
Parametric tests compare the distributions in the data for groups rather than using individual values for each sample. Remember that a parametric test can only be used if the data is normally distributed.
- T-test: A t-test is used to compare the means of two groups. For video instructions on undertaking a t-test two samples assuming unequal variance, click here.
- Click here for a Paired t-test video
- Single Factor ANOVA: used to compare two or more groups.
- Two-Way ANOVA: looking at one variable and comparing it to two others, for example, looking at Salaries by Department and Year. For video instructions on ANOVA in Excel, click here.
- For video instructions on how to calculate Pearson’s Correlation Coefficient (Pearson’s r) in Excel, click here.
Non-Parametric Tests
- A Mann-Whitney U Test is used to compare ordinal data or as a non-parametric test for interval data that is not normally distributed. A non-parametric test compares the individual ranked sample values for each group. This is different to a non-parametric test (for normally distributed data) where we disregard the individual values and compare the mean and standard deviations (i.e., comparing bell curves for degree of overlap). The Mann-Whitney U test creates a ranked list of values which it uses to compare the mediums of the 2 groups. For video instructions on calculating Mann-Whitney U in Excel there are three videos, click on the following links: Part 1, Part 2, Part 3.
- For video instructions on using Wilcoxon Signed-Rank Test in Excel, click here.
- For video instructions on Repeated Measures or Within-Subjects ANOVA in Excel click here.
5.4 Qualitative Data Analysis
Defining Types of Qualitative Data
Qualitative data are variables whose values fit in categories; they are not numerical. Qualitative data are either nominal or ordinal (Figure 5.5).
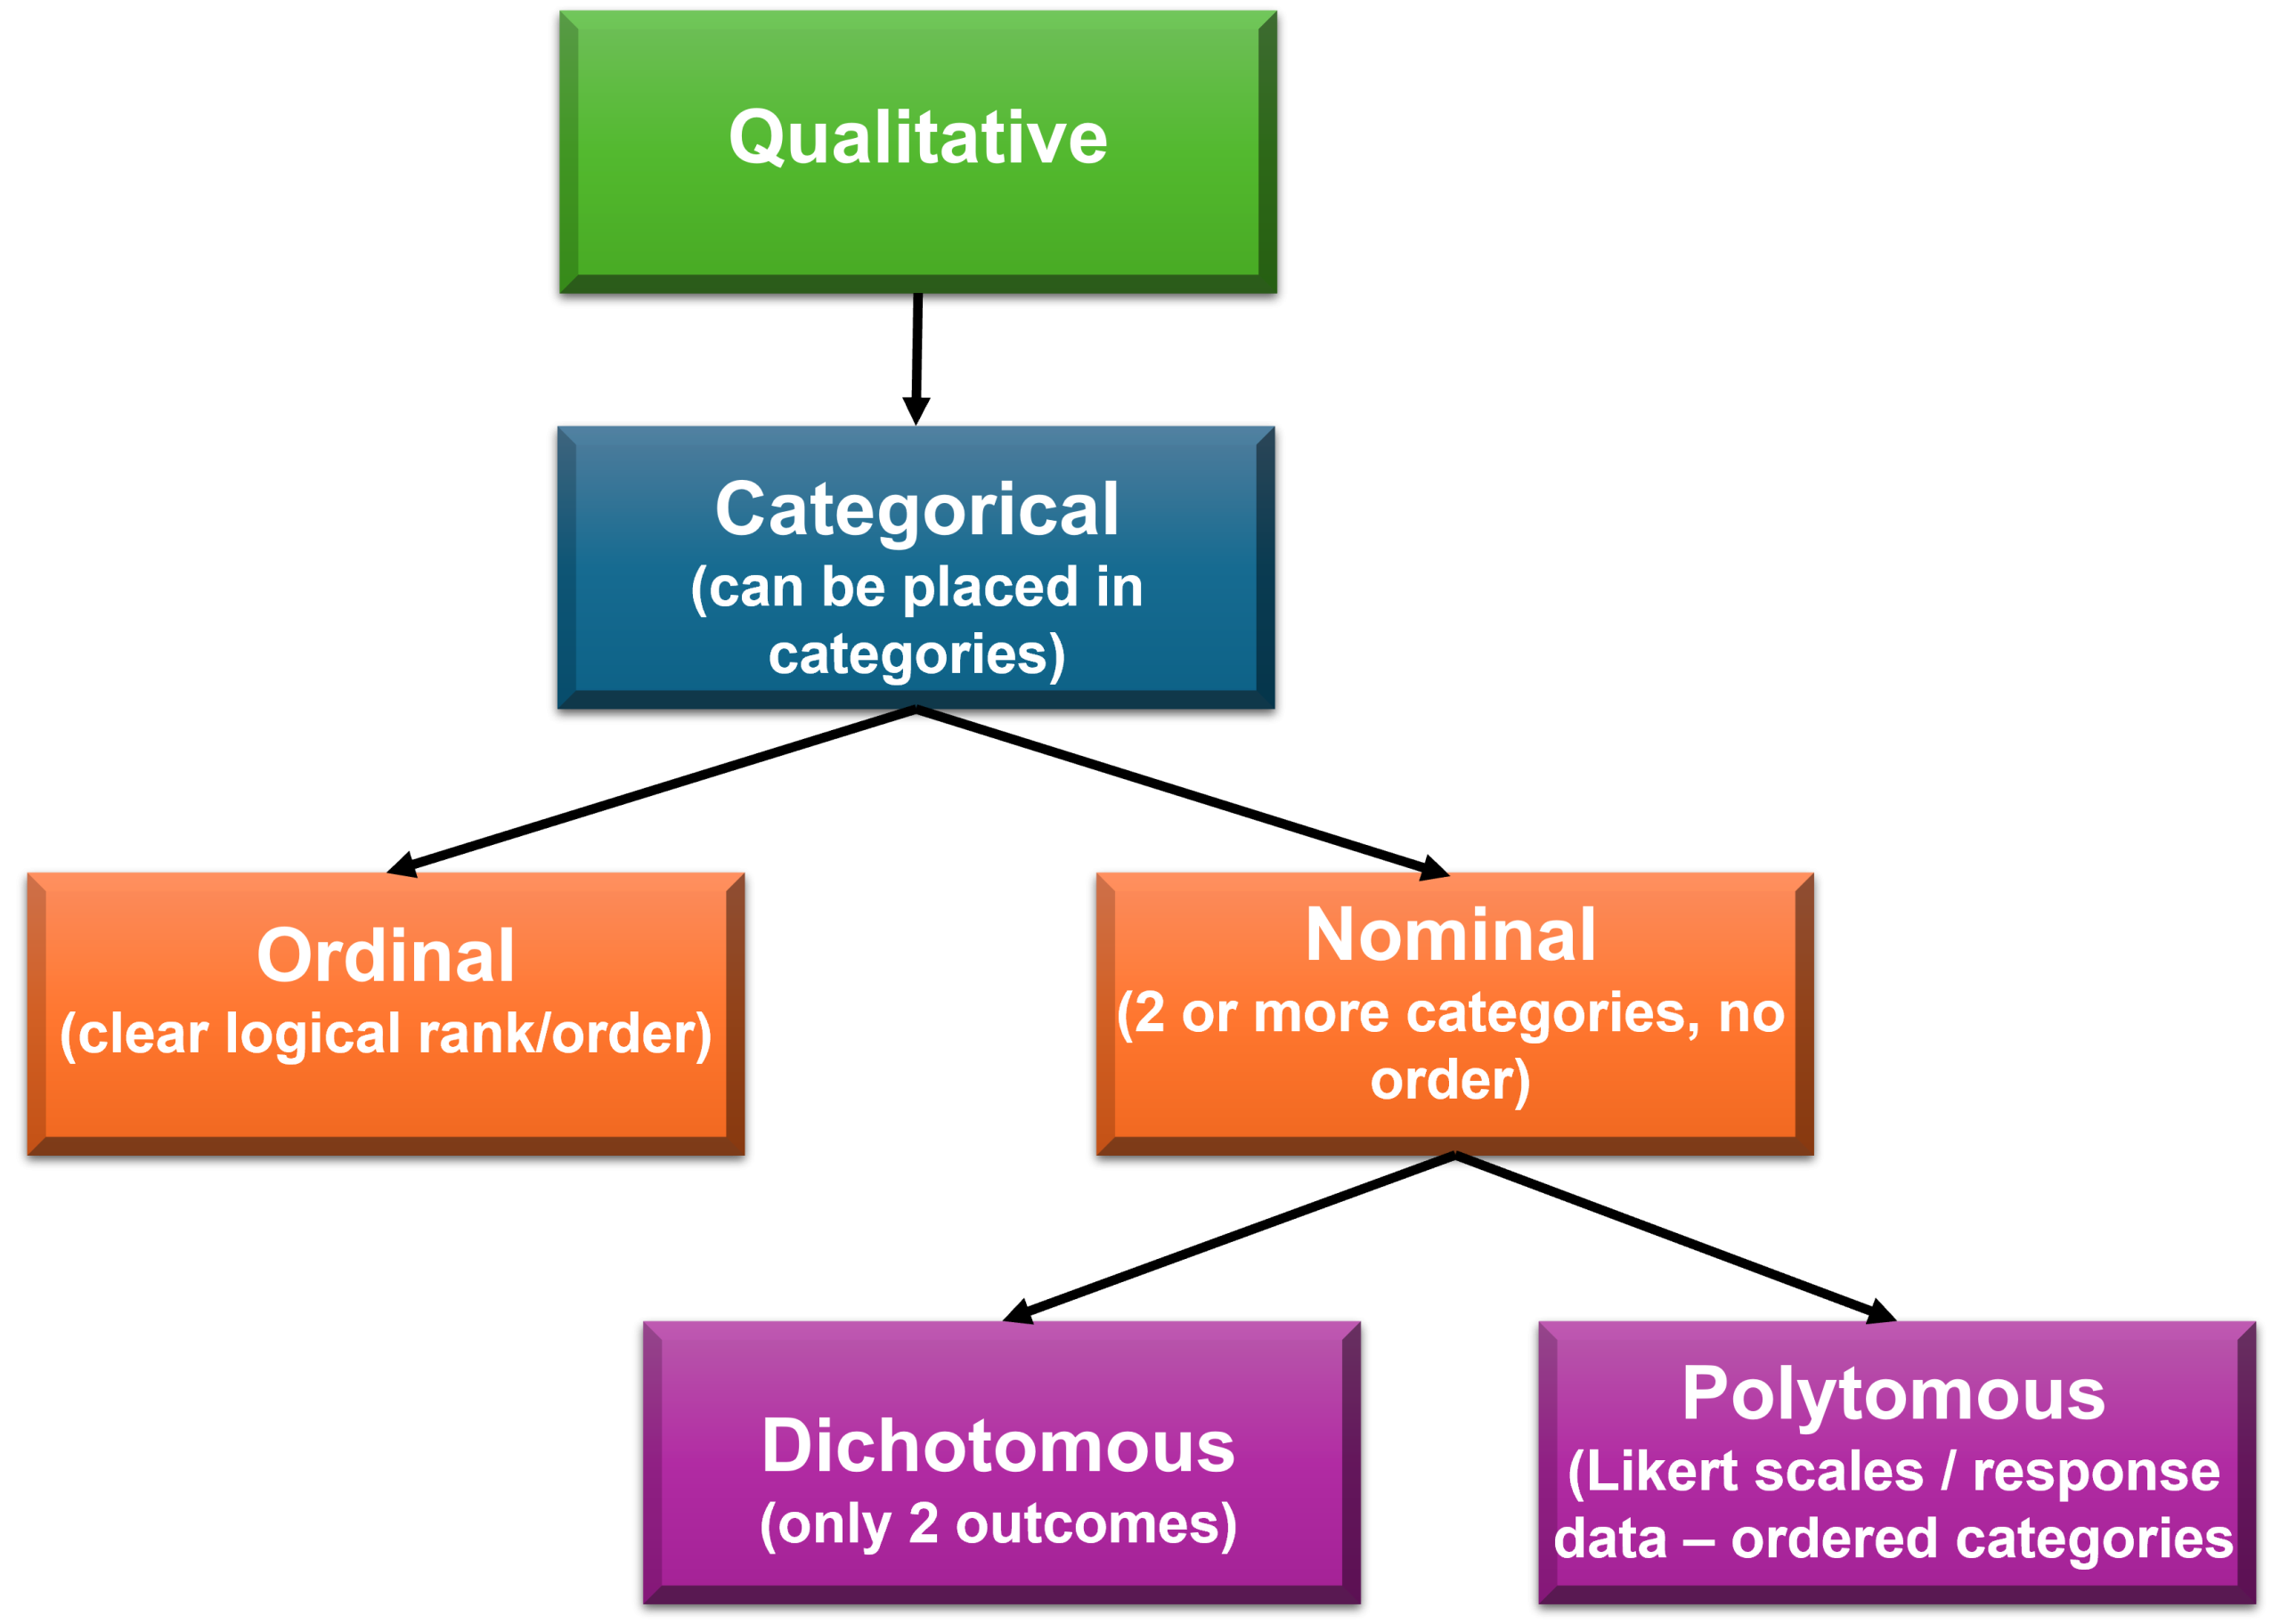
Ordinal Data
Ordinal data categories can be placed in a clear logical rank or order. For example, a person’s health can be categorised as poor, reasonable, good, or excellent, which provides a clear logical order. Although there is no even distribution between categories. Likert scales (Figure 5.6) are an example of ordinal data. However, be cautious with your analysis of data obtained from Likert-type scale questions, as they are often treated as quantitative interval data. The type of analysis all depends on your research question(s).

Nominal Data
- Nominal data categories have no ordering. For example, eye colour. Eyes can be blue, green, brown, hazel, multi-coloured; you cannot place them in an order.
- Nominal data with only 2 categories are dichotomous (also known as binary). For example: Do you own a dog? No/Yes.
- Dichotomous data can be assigned numbers in their data analysis software, for example, 0 = No, and 1 = Yes. This does not make the data quantitative; it is still qualitative and assists in preventing coding errors.
- Polytomous data (obtained from Likert-type scales [Figure 5.6]) have more than two values, for example, 0, 1, 2, 3…
Analysing Qualitative Data
Qualitative research presents many choices for research design, including ethnography, grounded theory, and phenomenology. When it comes to the analysis of qualitative data, most approaches are based on an iterative process of coding and recoding until some meaningful interpretation of the data can be arrived at. This approach means that there is a continual going back and forth of data and theory or theory and data, depending on whether the process is inductive (data to theory) or deductive (theory to data). In all approaches, the researchers immerse themselves in the data and build a story from the data.
With qualitative data analysis, the researcher is seeking to determine how the data fits together (Silverman, 2021). Coding helps to collate and label the data and by constantly comparing the data and the emerging codes, it is possible to identify where there are differences and to recognise patterns of similarity. Another tool that is used in qualitative data analysis is memos. Memos are important for keeping track of the researcher’s thinking about the data, why particular codes/variables/themes/categories are developed, and potential comparative investigations. Hence, the memos are really records for the researchers to remember what they have done and what they intend to do. They log the ‘journey of discovery’ as the story from the data is unravelled.
As the researcher works on collating the data, memos are written about the data, codes are developed to label the data, segments of the text are coded, and variables/themes/categories are created so that comparisons can be made, especially where differences in the patterns emerge (Ritchie et al., 2013). Codes assist in indexing the data and so comparable to the index in a book, which helps the researcher to find a particular topic.
Associate Professor Karen Andes (2021) refers to the four Rs of qualitative data analysis: Retrieve, Review, Reflect and Reduce. Codes (or themes/categories/variables) are used to retrieve data. Researchers then read & re-read data (i.e., review) that is retrieved, generally in conjunction with the memos that have been written so as to find patterns. The researcher then reflects upon the potential meaning of the codes (or themes/categories/variables) to see what comparisons and interpretations can be made. As part of the reflection process, the researcher may ask whether the patterns in the data are similar to or different from current understanding and knowledge or are the patterns indicate ‘new’ concepts or theories. This process of retrieving, reviewing and reflecting is iterative and in time, will reduce the data into concise and meaningful elements that can be described by the patterns that were observed.
In the last decade, there has been an increasing use of software to assist researchers in qualitative data analysis (e.g., NVivo, MAXQDA, QDAS, Leximancer). Regardless of these software tools, qualitative data analysis still relies on the researcher to immerse themselves in the data, develop the codes and know the story that is emerging from the data. The researcher still needs to interact with the data, be guided by the research questions and refine the definitions of the codes so that the codes are well-defined, meaningful, and manageable. A well-defined code is specific and clear about what segments of the data should be included in that code and what should not be included in that code.
Whether the research design adopts a deductive or inductive approach, and regardless of whether the software is used, the researcher needs to develop the code definitions inductively so that the data is represented with integrity. The importance of undertaking qualitative analysis in this way is that there may be unanticipated elements that emerge from the data. Hence, regardless of how the initial research design is derived (i.e., inductively or deductively), qualitative data analysis requires the researcher to lead the process.
There are many variants of qualitative data analysis, e.g., narrative analysis, discourse analysis, thematic analysis, interpretive analysis, sequential analysis, grounded theory, and meta-ethnography (Lester et al., 2020). Scholars such as Lester et al. (2020) argue that “thematic analysis is a useful starting point for learning how to conduct qualitative analysis, as it provides a foundation for learning other approaches” (p. 103). Essentially, thematic analysis forms the basis of a range of other approaches to qualitative data analysis. Often, it is the disciplinary emphasis that will determine the nuanced application of thematic analysis. For example, ethnographies are the research approach of choice for many anthropologists and their use of thematic analysis may be less structured than, say, a management scholar who uses ethnographies to study organisations. In both cases the rigour, reliability and validity of the work are commensurate, but in the former, the analysis may lead to a more narrative style of presentation of the work, whereas with the latter, the analysis and presentation of the results will be more consistent with conventional content analysis.
Content Analysis
Content analysis is a very good example of how qualitative data may be analysed. Content analysis is generally reserved for examining large volumes of textual material to identify patterns/trends in the words being used. It also seeks to determine the frequency of the words, their connections and the structures and discourses of the way in which the words are brought together (Bengtsson, 2016). Essentially, content analysis allows the researcher to transform the qualitative data into quantitative information because it enables the quantifying of words, messages or concepts and quantifies the relationships between concepts. Leximancer is a software program that utilises content analysis in its management of qualitative data. Hsieh and Shannon (2005) make a distinction between three different forms of content analysis. The first form is Conventional Content Analysis. For conventional content analysis, the researcher starts out by reading texts and then coding texts. A theoretical framework or a theory is not required. As the researcher develops codes, the researcher looks for how the codes can be grouped into themes. This process of coding is inductive and generally utilises a coding frame or scheme that has been developed by the researcher. For this process, the researcher generally develops sets of mechanisms so that the data is coded in the same way by all researchers involved in the project, with the same definitions. The mechanisms include descriptions/definitions of the codes, coding/interpretation rules, and instructions for coders. This approach allows for two (or more) researchers to undertake the coding and so add reliability to the analysis. Software programs such as NVivo present intercoder reliability measures such as Krippendorff’s alpha, which provide a measure of the consistency in coding between two (or more) researchers.
A second form of content analysis that is recognised by Hsieh and Shannon (2005) is Directed Content Analysis. In directed content analysis, the researcher brings in a coding scheme or a coding system that is drawn from theory established by other researchers, or it can be the researcher’s own theory, e.g., derived previously from a conventional content analysis. A third form of content analysis noted by Hsieh and Shannon (2005) is Summative Content Analysis. This type of content analysis is more quantitative in nature. Regardless of the type of content analysis, the goal of this technique is to break the text down into manageable codes for analysis. The analysis follows the following protocol: de-contextualisation, re-contextualisation, categorisation and compilation (Bengtsson, 2016). In the de-contextualisation stage, the researcher must immerse themselves in the data, i.e., read through the transcribed text to familiarise themselves with the data and to understand the data before breaking it into smaller meaningful units that are assigned as codes. For re-contextualisation, the researcher checks that all aspects of the content have been addressed in relation to the aim of the study. The original text is reread with the final list of codes, and any missed relevant text is included. In the categorisation stage, the codes are condensed, and themes are identified. These themes are then condensed even further into categories. In the final stage of compilation, once the themes and categories have been established, the interpretation of the results and the writing-up process begins.
Thematic Analysis
As the name suggests, thematic analysis is a technique for determining the themes that are emerging from the data. It is the most common form of qualitative analysis and is a process of finding, examining, classifying and reporting those themes (Braun & Clarke, 2006). Like the other approaches to qualitative analysis, it begins by identifying codes (or units of analysis) that emerge from the data.
The protocol for thematic analysis involves six phases: familiarising yourself with your data, generating initial codes, searching for themes, reviewing themes, defining and naming themes, and producing the report (Braun & Clarke, 2006). The process is iterative and reflective; it requires the researcher to move back and forth between the phases as the themes evolve and are consolidated.
Thematic analysis offers an analytical approach that is rigorous and allows for a detailed representation and description of the data. The researcher examines the data and codes for themes. The data can be interview transcripts, photos, drawings, videos, field notes, TripAdvisor comments, and memos. With content analysis, the research tries to organise the data and generally does so by using codes.
USEFUL VIDEO: Thematic analysis – an introduction by Professor Virginia Braun and Dr Victoria Clarke [1:02:20].
Sources of Additional Information
Delve (n.d.). The essential guide to coding qualitative data. https://delvetool.com/guide
Maher, C., Hadfield, M., Hutchings, M., & de Eyto, A. (2018). Ensuring rigor in qualitative data analysis: A design research approach to coding combining NVivo with traditional material methods. International Journal of Qualitative Methods, 17(1), https://doi.org/10.1177/1609406918786362
Medelyan, A. (2024, October 15). Thematic analysis software: 5 top tools and how it works. https://getthematic.com/insights/thematic-analysis-software/
St Pierre, E. A., & Jackson, A. Y. (2014). Qualitative data analysis after coding. Qualitative Inquiry, 20(6), 715-719. https://doi.org/10.1177/1077800414532435
Key Takeaways
- Data that cannot be measured numerically in quantities are categorical data.
- Categorical data can be descriptive and dichotomous or descriptive and nominal or ranked and ordinal.
- Data that can be measured numerically as quantities are numerical data.
- Numerical data can be interval or ratio or continuous or discrete.
- Excel can be used to analyse data in various ways.
- Quantitative data is numerical.
- Qualitative data is non-numerical.
- Research can combine quantitative and qualitative approaches, this is called mixed methods.
- Thematic analysis is a technique that is used for analysing qualitative data. It involves the researcher immersing themself in the data by reading through the data and looking for patterns in the meaning of the data, with a view to creating codes and from the codes to find the themes that emerge from the data. It is an active and iterative process that involves reflexivity and the researcher’s ability to make sense of the data.
References
Andes, K. (2021). QDAS use as workflow design: An interview with Karen Andes. https://study.sagepub.com/dqr6/student-resources/chapter-15/watch
Bengtsson M. (2016). How to plan and perform a qualitative study using content analysis. Nursing Plus Open, 2, 8-14. https://doi.org/10.1016/j.npls.2016.01.001
Braun V., & Clarke V. (2006). Using thematic analysis in psychology. Qualitative Research in Psychology, 3(2), 77-101. https://doi.org/10.1191/1478088706qp063oa
Hsieh, H.-F., & Shannon, S. E. (2005). Three approaches to qualitative content analysis. Qualitative Health Research, 15(9), 1277–1288. https://doi.10.1177/1049732305276687
Lester, J. N., Cho, Y., & Lochmiller, C. R. (2020). Learning to do qualitative data analysis: A starting point. Human Resource Development Review, 19(1), 94–106. https://doi.org/10.1177/1534484320903890
Manning, M. & Munro, D. (2007). The survey researcher’s SPSS cookbook (2nd ed.). Pearson Education Australia.
McNabb, D. E. (2021). Research methods for political science: Quantitative, qualitative, and mixed methods approaches (3rd ed.). Routledge.
Ritchie, J., Lewis, J., McNaughton Nicholls, C., & Ormston, R. (2013). Qualitative research practice. Sage Publishing.
Sallis, J. E., Gripsrud, G., Olsson, U. H., & Silkoset, R. (2021). Research methods and data analysis for business decisions: a primer using SPSS. Springer. https://doi.org/10.1007/978-3-030-84421-9
Silverman, D. (2021). Doing qualitative research (6th ed.). Sage Publishing.
Tracy, S. J. (2019). Qualitative research methods: Collecting evidence, crafting analysis, communicating impact (2nd ed.). John Wiley and Sons.
