8.2. Reliability
By Rajiv S. Jhangiani, I-Chant A. Chiang, Carrie Cuttler and Dana C. Leighton, adapted by Marc Chao and Muhamad Alif Bin Ibrahim
Reliability refers to the consistency of a measurement tool. A reliable measure produces stable and consistent results across time, across different items within the same test, and across different observers. In psychology, reliability is assessed in three main ways: test-retest reliability, internal consistency, and inter-rater reliability.
Test-Retest Reliability
When researchers measure something they expect to remain stable over time, the results should also remain consistent. Test-retest reliability refers to how well a measurement tool produces similar results when used on the same people at different points in time.
For example, intelligence is generally considered a stable trait. If someone scores high on an intelligence test today, they should score similarly next week. If the test produces very different scores each time, it is not a reliable tool for measuring a stable construct like intelligence.
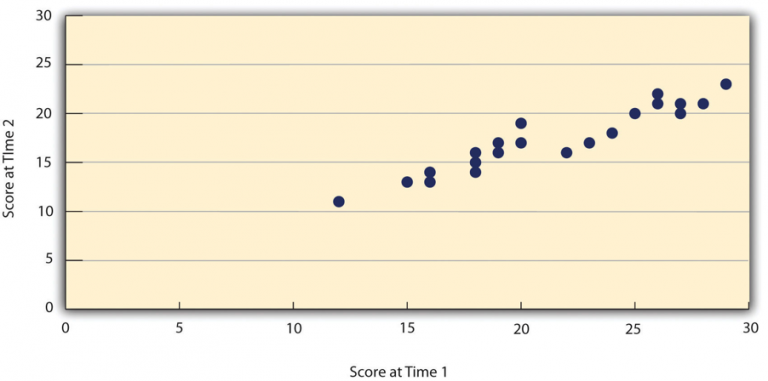
To evaluate test-retest reliability, researchers measure the same group of people twice using the same tool, usually with a gap of a few days or weeks between the two measurements. They then compare the two sets of scores using a correlation coefficient, which indicates how closely the two measurements match. A scatterplot is often used to visually represent this relationship.
For instance, in Figure 8.2.1, we can see that if university students take the Rosenberg Self-Esteem Scale twice, one week apart, and the two sets of scores have a correlation coefficient of +0.95, this indicates excellent reliability. In general, a correlation of +0.80 or higher suggests good test-retest reliability.
However, not all psychological constructs are expected to remain stable over time. Traits like intelligence, self-esteem, and personality dimensions (e.g., the Big Five traits) are typically consistent, so high test-retest reliability is expected. On the other hand, constructs like mood are naturally more variable. If a mood-measuring tool shows low test-retest reliability over a month, that is not necessarily a problem because mood is expected to change frequently.
Internal Consistency
Internal consistency refers to how well the items on a multi-item measure align with each other in assessing the same underlying construct. When researchers use multiple questions or tasks to measure something like self-esteem, they expect the responses to be consistent across those items. For example, on the Rosenberg Self-Esteem Scale, someone who agrees with the statement “I feel I am a person of worth” should also agree with “I have a number of good qualities”. If responses to these items are not correlated, it suggests they might not be measuring the same underlying trait.
This principle applies not only to self-report questionnaires but also to behavioural and physiological measures. For instance, if someone repeatedly places high bets in a simulated gambling game, their behaviour demonstrates consistency in risk-taking. If their betting patterns are unpredictable, it undermines the claim that the game measures their level of risk-seeking behaviour.
Assessing Internal Consistency
Just like test-retest reliability, internal consistency is evaluated by collecting and analysing data. One common method is the split-half correlation:
- The items on the measure are split into two groups, such as even-numbered and odd-numbered items.
- Scores are calculated separately for each group.
- The correlation between these two sets of scores is then assessed.
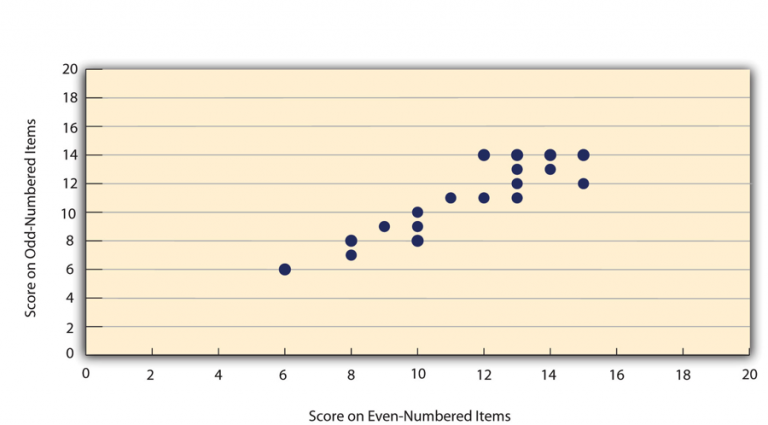
For example, in Figure 8.2.2, we can see that if university students’ scores on the even-numbered items of the Rosenberg Self-Esteem Scale are strongly correlated with their scores on the odd-numbered items (e.g., +0.88), it indicates good internal consistency. Generally, a split-half correlation of +0.80 or higher suggests strong internal consistency.
Cronbach’s Alpha (α)
The most widely used statistic for measuring internal consistency is called Cronbach’s alpha (α). Conceptually, Cronbach’s α represents the average of all possible split-half correlations for a set of items. For example, if a survey has 10 items, there are 252 different ways to divide them into two groups of five items. Cronbach’s α essentially summarises the average correlation across all these splits.
While the actual calculation of α is more complex, understanding it as an average of split-half correlations is a useful way to interpret its meaning. In general, an α value of +0.80 or higher indicates good internal consistency.
Inter-Rater Reliability
When researchers use behavioural measures to study human behaviour, they often rely on observers or raters to make judgements. Interrater reliability refers to how consistently different observers evaluate the same behaviour or event. In simple terms, it measures whether multiple observers agree in their assessments.
For example, imagine a study on university students’ social skills. Researchers might record students interacting with someone they have just met and then ask two or more observers to watch the videos and rate each student’s social skills. If social skills are a measurable trait, attentive observers should provide similar ratings for the same student. High agreement among observers indicates strong interrater reliability.
Another classic example is Bandura’s Bobo doll experiment, where observers counted acts of aggression performed by children interacting with a clown-shaped doll. If two observers recorded similar numbers of aggressive actions for each child, their ratings would show high interrater reliability.
Measuring Interrater Reliability
To quantify interrater reliability, researchers use statistical tools:
- Cronbach’s alpha (α): Used when the ratings are quantitative (e.g., rating social skills on a scale from 1 to 10).
- Cohen’s kappa (κ): Used when the ratings are categorical (e.g., classifying behaviour as either “aggressive” or “non-aggressive”).
Both statistics provide a numerical value that indicates the level of agreement among observers, helping researchers ensure that their measurements are reliable and consistent across different raters.
Chapter Attribution
Content adapted, with editorial changes, from:
Research methods in psychology, (4th ed.), (2019) by R. S. Jhangiani et al., Kwantlen Polytechnic University, is used under a CC BY-NC-SA licence.
