10.2. Measures of Central Tendency
By Rajiv S. Jhangiani, I-Chant A. Chiang, Carrie Cuttler and Dana C. Leighton, adapted by Marc Chao and Muhamad Alif Bin Ibrahim
Central tendency refers to the middle point or centre of a set of data, which is a value around which the scores in a dataset tend to cluster. In simpler terms, it represents the “average” or typical value in a distribution. For example, if we look back at the self-esteem scores in Figure 9.1, we can see that most scores are clustered around the values 20 to 22. There are three main ways to measure central tendency: the mean, the median, and the mode.
The Mean (M)
The mean is the most common measure of central tendency and is often referred to as the average. It is calculated by adding up all the scores and then dividing the total by the number of scores. Mathematically, it is expressed as:
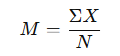
- Σ (sigma): Represents the summation.
- X: Represents each individual score. Hence, ΣX means to sum across the values of the variable X.
- N: Represents the total number of scores.
The mean is widely used because it is easy to calculate, easy to understand, and has statistical properties that make it valuable for advanced analysis. However, the mean can be misleading in datasets with extreme scores (outliers) because those extreme values can significantly affect the result.
The Median
The median is the middle score in a dataset when the scores are arranged in order from lowest to highest. It splits the data so that half the scores are below it and half are above it.
To find the median:
- Arrange the scores from lowest to highest.
- Identify the middle value.
Example: Consider the dataset: 8, 4, 12, 14, 3, 2, 3.
Step 1: Arrange the scores in order → 2, 3, 3, 4, 8, 12, 14.
Step 2: Identify the middle score → The median is 4 because it is the middle value with three scores below and three scores above.
When there is an even number of scores, the median is the mean average of the two middle scores. For example, if we add a score of 15 to the dataset, we now have: 2, 3, 3, 4, 8, 12, 14, 15. The middle two scores are 4 and 8, so the median would be:
- (4 + 8) / 2 = 6
The median is less affected by outliers than the mean, making it a better measure of central tendency for skewed datasets.
The Mode
The mode is the most frequently occurring score in a dataset. It identifies the value that appears the most often.
For example, in the self-esteem dataset shown in Table 9.1 and Figure 9.1, the mode is 22, as more students had this score than any other.
The mode is unique because:
- It can be used for both quantitative and categorical data.
- A dataset can have more than one mode (bimodal or multimodal).
Comparing the Mean, Median, and Mode
In a symmetrical, unimodal distribution (a dataset with one clear peak), the mean, median, and mode are typically very close to each other, sitting around the peak.
In a bimodal distribution (a dataset with two peaks), the mean and median fall between the two peaks, while the mode aligns with the peaks.
In a skewed distribution:
- A positively skewed distribution (tail extends to the right): The mean is pulled toward the higher scores, making it larger than the median.
- A negatively skewed distribution (tail extends to the left): The mean is pulled toward the lower scores, making it smaller than the median.
Example of Skewed Data:
Consider these reaction times (in milliseconds): 200, 250, 280, 250.
- The mean is 245 ms.
If we add one outlier of 5,000 ms (an unusually long delay), the mean jumps to 1,445 ms, even though most scores are much lower. In such cases, the median (which remains unaffected by the outlier) is a better representation of central tendency.
Which Measure Should You Use?
Each measure of central tendency provides a different perspective on the data:
- Mean: Best for normally distributed data without outliers.
- Median: Best for skewed data or when outliers are present.
- Mode: Useful for identifying the most frequent value and can be applied to categorical data.
You do not have to rely on just one measure. Often, using multiple measures together gives a clearer and more accurate picture of the data’s central point.
Chapter Attribution
Content adapted, with editorial changes, from:
Research methods in psychology, (4th ed.), (2019) by R. S. Jhangiani et al., Kwantlen Polytechnic University, is used under a CC BY-NC-SA licence.
