11.5. Type I and Type II Errors
By Rajiv S. Jhangiani, I-Chant A. Chiang, Carrie Cuttler and Dana C. Leighton, adapted by Marc Chao and Muhamad Alif Bin Ibrahim
Null hypothesis testing is a statistical process used by researchers to draw conclusions about a population based on the analysis of sample data. The ultimate goal is to determine whether there is enough evidence to reject the null hypothesis (which assumes no effect or relationship) or to retain it. However, these conclusions are not always guaranteed to be correct because of the inherent limitations of sampling and statistical testing. Errors can occur, leading researchers to make incorrect decisions about the null hypothesis.
To understand these potential errors, consider the four possible outcomes of a null hypothesis test, as illustrated in Figure 11.5.1. These outcomes arise from the interplay between the actual state of the null hypothesis in the population (true or false) and the researcher’s decision to reject or retain the null hypothesis based on sample data.
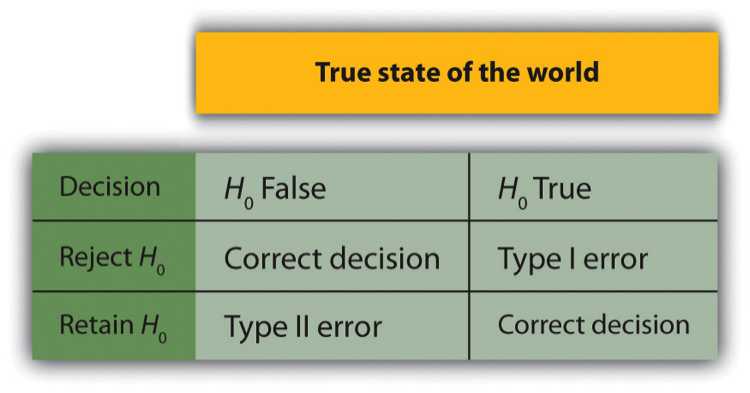
Four Possible Outcomes in Null Hypothesis Testing
Correct Decision: Rejecting a False Null Hypothesis
- Scenario: The null hypothesis is false in the population, meaning there is an actual effect or relationship. The researcher correctly rejects the null hypothesis based on the sample data.
- Significance: This is the ideal outcome, indicating that the test successfully identified a real effect or relationship in the population.
- Example: A study finds a significant difference in weight loss between two diets, and this difference also exists in the population.
Correct Decision: Retaining a True Null Hypothesis
- Scenario: The null hypothesis is true in the population, meaning there is no effect or relationship. The researcher correctly retains the null hypothesis, concluding that the sample data do not provide sufficient evidence of an effect.
- Significance: This outcome reflects the proper use of statistical analysis, avoiding overinterpretation of random sampling variability.
- Example: A study finds no significant difference in test scores between two teaching methods, and there is no actual difference in the population.
Type I Error: Rejecting a True Null Hypothesis
- Scenario: The null hypothesis is true in the population, but the researcher erroneously rejects it based on the sample data.
- Definition: This is known as a Type I error, where a false positive occurs, and the test identifies an effect or relationship that does not actually exist.
- Cause: Type I errors are typically caused by random sampling variability and are influenced by the significance level (α) set by the researcher. For example, with α = 0.05, there is a 5% chance of committing a Type I error.
- Example: A study concludes that a new medication improves patient outcomes, but in reality, the medication has no effect.
Type II Error: Retaining a False Null Hypothesis
- Scenario: The null hypothesis is false in the population, but the researcher fails to reject it based on the sample data.
- Definition: This is known as a Type II error, where a false negative occurs, and the test fails to detect an effect or relationship that actually exists.
- Cause: Type II errors are often due to inadequate statistical power, which may result from a small sample size, a weak effect, or high variability in the data.
- Example: A study finds no significant improvement in learning outcomes using a new teaching method, even though it is effective in the population.
Type I and Type II Errors
Errors in statistical hypothesis testing are an inherent part of the research process, primarily because conclusions about populations are drawn from sample data. These errors, referred to as Type I and Type II errors, arise due to sampling variability, limitations in research design, or decisions about statistical thresholds.
Type I Error: False Positive
A Type I error occurs when a researcher rejects the null hypothesis (H0) even though it is true in the population. This type of error leads to a false positive result, suggesting the presence of an effect or relationship that does not actually exist.
- Cause: Even when there is no true relationship in the population, random sampling error can occasionally produce extreme sample results. These extreme results can lead to the rejection of the null hypothesis.
- Role of Significance Level (α): The significance level, α, determines the threshold for rejecting the null hypothesis. It represents the probability of committing a Type I error. For instance, if α = 0.05, there is a 5% chance of rejecting a true null hypothesis purely due to random sampling error.
- This is why α is often called the “Type I error rate”.
- Implications: A Type I error can lead researchers to falsely conclude that an intervention, treatment, or relationship is effective when it is not. This can have significant consequences, such as implementing ineffective medical treatments or drawing incorrect scientific conclusions.
- Example: Suppose a clinical trial tests a new medication and finds a statistically significant improvement in patients’ outcomes. If this result is a Type I error, the medication does not actually provide any benefit, and the observed effect is due to random chance.
Type II Error: False Negative
A Type II error occurs when a researcher fails to reject the null hypothesis (H0) even though it is false in the population. This type of error results in a false negative, meaning the researcher overlooks a real effect or relationship.
- Cause: Type II errors often stem from a lack of statistical power in the research design. Statistical power is the probability of correctly rejecting the null hypothesis when it is false.
- Factors reducing power:
- Small sample sizes
- High variability in the data
- Weak effects or relationships in the population
- Balancing Type II Errors and α: Adjusting the significance level can influence the likelihood of a Type II error. Lowering α (e.g., from 0.05 to 0.01) makes it harder to reject the null hypothesis, thereby increasing the risk of Type II errors. Conversely, raising α (e.g., to 0.10) makes it easier to reject the null hypothesis, reducing the likelihood of Type II errors but increasing the risk of Type I errors.
- Implications: A Type II error can prevent researchers from identifying effective treatments, interventions, or relationships. This oversight can lead to missed opportunities for advancements or improvements in various fields.
- Example: A study investigates whether a new teaching method improves student performance. If the study fails to detect a significant difference due to a Type II error, the method might be incorrectly dismissed as ineffective, even though it could benefit students.
Balancing Type I and Type II Errors
Researchers must carefully balance the risks of Type I and Type II errors when designing studies and interpreting results. The commonly used significance level of α = 0.05 reflects a compromise between these risks, aiming to keep both error rates at acceptable levels. However, the appropriate balance may vary depending on the context of the research.
- Lowering Type I Errors: Reducing α (e.g., to 0.01) decreases the likelihood of false positives but increases the probability of Type II errors. This approach is often used in fields where the consequences of a Type I error are severe, such as drug approvals or medical diagnostics.
- Reducing Type II Errors: Increasing statistical power through larger sample sizes, better-controlled experiments, or stronger manipulations can reduce the likelihood of Type II errors. This ensures a greater chance of detecting real effects or relationships when they exist.
Implications of Errors in Research and Addressing Bias in the Literature
Errors in null hypothesis testing, such as Type I and Type II errors, have significant implications for interpreting research findings and the advancement of scientific knowledge. Researchers must remain aware of these potential errors and their consequences to ensure their conclusions are reliable and accurate. Below, we explore these implications in greater detail and discuss solutions to mitigate their impact.
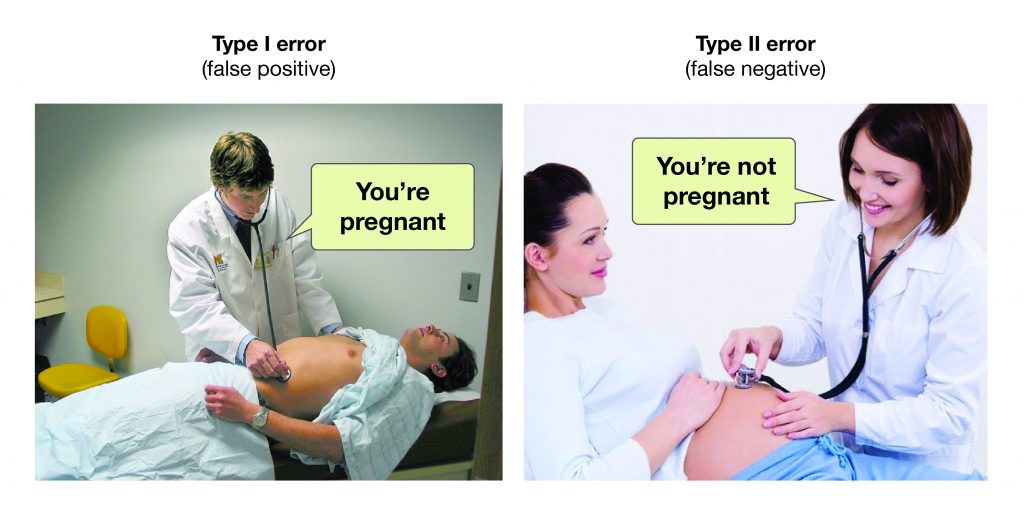
Caution in Interpreting Results
Every study, no matter how well-designed, carries the risk of a Type I or Type II error (Figure 11.5.2). This inherent uncertainty means researchers should approach their findings with caution, recognising that an observed result could either falsely indicate a relationship (Type I error) or fail to detect a real one (Type II error).
Importance of Replication:
- Replication is a cornerstone of reliable science. Each successful replication, where independent researchers conduct the same study and obtain similar results, bolsters confidence that a finding reflects a genuine phenomenon rather than an error.
- For example, if a study finds a significant relationship between exercise and improved memory performance, replication ensures the result is not due to random chance, sampling variability, or methodological flaws.
- Meta-analyses, which aggregate findings from multiple studies, further enhance reliability by reducing the influence of outliers or single-study errors.
The File Drawer Problem
One significant issue in scientific research is the file drawer problem, first articulated by Rosenthal in 1979. This problem arises from the tendency for researchers and journals to prioritise publishing statistically significant results while relegating non-significant findings to obscurity. In other words, placing them in a “file drawer” figuratively.
- Inflated Proportion of Type I Errors in Published Research: When only significant results are published, the research literature becomes biased, overrepresenting false positives (Type I errors). Studies that find no relationship or fail to reach statistical significance, even when accurately reflecting the population, are underreported.
- Impact on True Relationships: This bias can also distort the perceived strength of relationships. For instance, if a weak positive correlation exists between two variables in the population, published studies may disproportionately report stronger correlations due to random sampling error and the file drawer effect. This creates a misleading picture, exaggerating the strength of the true relationship.
- Example: Imagine multiple studies examining the relationship between caffeine intake and cognitive performance. Some studies show weak or no effect, while a few, due to sampling variability, report moderate or strong effects. If only the latter are published, readers might wrongly conclude that caffeine has a robust impact on cognition, while the true effect is minimal or non-existent.
Addressing the File Drawer Problem
The file drawer problem is deeply embedded in traditional research and publishing practices. However, researchers and journals are increasingly adopting innovative solutions to counteract this bias and ensure a more balanced representation of findings.
Registered Reports: Shifting the Focus to Research Quality
Registered reports are a publishing format where journals evaluate a study based on its research question and methodology, rather than its results. Researchers submit their study design and hypotheses for review before data collection. If the design is deemed rigorous, the journal commits to publishing the results regardless of whether they are significant or non-significant.
- Benefits:
- Reduces the bias toward publishing significant results.
- Encourages transparent and well-planned research.
- Ensures that non-significant findings are valued equally, as they contribute to the broader understanding of a topic.
- Example:
- The Centre for Open Science promotes registered reports through initiatives like this platform, fostering fair evaluation across scientific disciplines.
Sharing Non-Significant Results
Researchers can actively address publication bias by sharing non-significant findings through alternative avenues:
- Public Repositories: Platforms like the Open Science Framework allow researchers to upload and share raw data, methodologies, and results, making them accessible to the scientific community.
- Professional Conferences: Conferences provide opportunities for researchers to present non-significant findings and foster discussions about their implications.
- Dedicated Journals: Some journals specifically focus on non-significant findings, such as the Journal of Articles in Support of the Null Hypothesis. These outlets help balance the literature by highlighting studies that may otherwise remain unpublished.
Promoting Cultural Change in Science
Addressing the file drawer problem requires a cultural shift in how research is evaluated and rewarded. By recognising the value of all results, whether significant or not, scientific disciplines can move toward a more complete and accurate understanding of phenomena.
p-Hacking and Its Consequences
In 2014, researchers Uri Simonsohn, Leif Nelson, and Joseph Simmons brought significant attention to a widespread but problematic practice in psychological research known as p-hacking. This practice involves researchers making intentional or unintentional adjustments to their data analyses in order to achieve statistically significant p-values, which are often considered necessary for publication. While p-hacking may seem harmless on the surface, it has significant consequences for the reliability and validity of scientific findings.
What is p-Hacking?
p-hacking encompasses a range of questionable research practices aimed at “hacking” the p-value, which represents the probability of observing a result as extreme as the one obtained, assuming the null hypothesis is true. A p-value of 0.05 or less is often treated as the threshold for statistical significance, making it a key benchmark for whether results are published. Researchers engaging in p-hacking manipulate their analyses to cross this threshold, even if the underlying data do not genuinely support such conclusions.
Examples of p-Hacking Tactics:
- Selective Removal of Outliers: Researchers may exclude certain data points that seem to weaken the statistical significance of their findings, labelling them as “outliers”.
- Data Snooping: Running multiple statistical tests on the same dataset and selectively reporting only the tests that yield significant results.
- Selective Reporting of Variables: Including or excluding variables from the analysis until significant results are obtained.
- Stopping Data Collection Early or Extending It: Stopping data collection as soon as a significant p-value is achieved or continuing to collect data until significance is reached.
- Post Hoc Hypothesis Formulation: Formulating hypotheses after the results are known, presenting them as if they were predicted in advance.
Consequences of p-Hacking
The widespread use of p-hacking undermines the foundation of scientific research by increasing the likelihood of Type I errors, or false positives, where researchers mistakenly conclude that a relationship or effect exists when it does not. This leads to several cascading problems:
- Inflated False Positives in the Literature: p-hacking inflates the number of published studies that report significant findings, even when these findings are due to random chance rather than real effects. This distorts the scientific literature, making it difficult for other researchers to discern true relationships or effects.
- Reduced Replicability: Studies influenced by p-hacking are less likely to replicate. When other researchers attempt to reproduce these findings, they often fail because the original results were artifacts of manipulated analyses rather than genuine phenomena.
- Erosion of Public and Academic Trust: When p-hacking is revealed, it undermines trust in science as a whole. Both the public and the academic community may become sceptical of research findings, questioning whether they are genuine or the result of data manipulation.
- Misdirected Resources and Efforts: Researchers, funding agencies, and practitioners may waste time and resources pursuing ideas or interventions based on spurious findings. This slows progress and diverts attention from potentially meaningful discoveries.
The 2014 Exposé and Its Impact
The work of Simonsohn, Nelson, and Simmons served as a wake-up call for the scientific community. Their research demonstrated how easily researchers could manipulate their analyses to produce significant p-values, even from entirely random datasets. Their findings highlighted the systemic vulnerability of research practices in psychology and other fields, sparking an ongoing conversation about the credibility of scientific research.
However, p-hacking is not always deliberate. In many cases, researchers may unknowingly engage in these practices due to pressure to publish or misunderstandings about proper statistical procedures. The emphasis on statistical significance as a criterion for publication incentivises p-hacking, creating a culture where “getting the right result” becomes more important than accurate reporting.
Chapter Attribution
Content adapted, with editorial changes, from:
Research methods in psychology, (4th ed.), (2019) by R. S. Jhangiani et al., Kwantlen Polytechnic University, is used under a CC BY-NC-SA licence.
