9.6. Survey Research
By Rajiv S. Jhangiani, I-Chant A. Chiang, Carrie Cuttler and Dana C. Leighton, adapted by Marc Chao and Muhamad Alif Bin Ibrahim
Survey research is a method used in both quantitative and qualitative studies, characterised by two key features.
First, self-reports are used to measure variables. In quantitative research, researchers typically gather information through questionnaires, asking participants, often referred to as respondents, to share their thoughts, feelings, and behaviours directly. Such questionnaires may include some open-ended questions. In fully qualitative surveys, participants respond in their own words to a series of pre-determined open-ended questions. These responses are subsequently analysed to provide in-depth insights into participants’ framework of meanings, including how they understand and interpret their social world.
Second, sampling plays a crucial role. Survey researchers prioritise large random samples because they provide the most accurate representation of the larger population. In fact, survey research is one of the few approaches in psychology where random sampling is a standard practice.
Beyond these two defining features, surveys are highly flexible. They can vary in length (short or long) and format (in-person, telephone, mail, or online). Surveys can cover a wide range of topics, including voting preferences, consumer habits, social attitudes, health issues, or anything else people can meaningfully respond to. While survey data are often analysed using statistical methods, some research questions are better suited for qualitative analysis.
Non-Experimental and Experimental Survey Research
Most survey research is non-experimental and focuses on two primary goals:
- describing single variables, such as identifying the percentage of voters supporting a candidate or the prevalence of a mental health condition
- assessing relationships between variables, like studying the connection between income and health.
However, surveys can also be used in experimental research. For example, in the aftermath of the September 2001 terrorist attacks, Jennifer Lerner and her colleagues surveyed nearly 2,000 American teens and adults to examine their emotional reactions and risk perceptions. They found that participants primed to feel anger perceived less risk, while those primed to feel fear perceived greater risk, highlighting how specific emotions influence risk assessment. In their study, they used self-report measures and a large national sample, which aligns with typical survey research. However, they also manipulated an independent variable (e.g., inducing feelings of anger or fear) to observe its effect on a dependent variable (e.g., risk judgements), making it an experimental study as well.
History and Uses of Survey Research
Survey research traces its origins to early 20th-century social surveys in England and the United States, where researchers aimed to document social issues such as poverty (Converse, 1987). By the 1930s, the U.S. government began using surveys to understand economic and social conditions, leading to advancements in sampling techniques. Around the same time, market researchers transitioned into election polling, refining survey methods to predict public opinion more accurately.
A pivotal moment occurred during the 1936 U.S. presidential election between Alf Landon and Franklin Roosevelt. The magazine Literary Digest predicted a Landon victory based on a massive mail survey. In contrast, George Gallup, using smaller but scientifically selected samples, predicted a Roosevelt landslide. Gallup’s prediction was correct, proving the power of methodologically sound surveys. This success laid the foundation for the first national election survey in 1948 by the Survey Research Centre at the University of Michigan, now known as the American National Election Studies.
Survey research soon became a cornerstone in fields such as political science, sociology, and public health. In the 1930s, psychologists made significant contributions to questionnaire design, including the widely used Likert scale. Surveys also played a key role in the social psychological study of attitudes, stereotypes, and prejudice, encouraging the use of larger and more diverse samples beyond the convenience of university students.
Today, survey research remains essential in psychology. Large-scale surveys, like the National Comorbidity Survey, have been instrumental in estimating the prevalence of mental disorders and exploring their relationships with other factors. For example, nearly 10,000 adults were interviewed in their homes in 2002–2003, revealing valuable insights into the lifetime prevalence of disorders such as generalised anxiety, depression, and substance abuse (see Table 9.6.1).
| Lifetime prevalence* | |||
| Disorder | Total | Female | Male |
| Generalised anxiety disorder | 5.7 | 7.1 | 4.2 |
| Obsessive-compulsive disorder | 2.3 | 3.1 | 1.6 |
| Major depressive disorder | 16.9 | 20.2 | 13.2 |
| Bipolar disorder | 4.4 | 4.5 | 4.3 |
| Alcohol abuse | 13.2 | 7.5 | 19.6 |
| Drug abuse | 8.0 | 4.8 | 11.6 |
| *The lifetime prevalence of a disorder is the percentage of people in the population who develop that disorder at any time in their lives. | |||
Survey research is also flexible enough to be integrated into experimental studies to test causal hypotheses. Large and diverse survey samples can complement laboratory studies, offering a broader perspective on psychological phenomena.
Constructing Surveys
The core of any survey research project is the survey itself. While coming up with interesting questions may seem simple, creating a well-designed survey is far from easy. The way people respond can be unintentionally influenced by factors such as how questions are worded, the order in which they appear, the response options provided, and other subtle details.
At best, these factors add random noise to the data, making it harder to identify clear patterns. At worst, they create systematic biases that can lead to misleading conclusions.
To ensure that survey responses are as accurate and trustworthy as possible, researchers must carefully design their surveys to minimise these unintended effects.
Survey Responding as a Psychological Process
Before diving into the specific principles of designing a survey, it is helpful to understand that answering survey questions is a psychological process. Respondents do not just provide answers. Instead, they go through a series of mental steps to interpret questions, retrieve relevant information from memory, make judgements, and then choose a response.
A Cognitive Model of Survey Responding
When people respond to a survey question, they go through several mental steps, as illustrated in the cognitive model developed by Sudman et al. (1996). Figure 9.6.1 lists the steps involved in the cognitive model of survey responding.

Take this example question:
How many alcoholic drinks do you consume in a typical day?
- a lot more than average
- somewhat more than average
- average
- somewhat fewer than average
- a lot fewer than average.
At first glance, the question seems simple, but it actually presents multiple challenges.
Step 1: Interpreting the Question
Respondents must first understand the question. They need to decide if “alcoholic drinks” include beer, wine and hard liquor, or just hard liquor. They must also decide if “a typical day” refers to a weekday, a weekend day, or both. Although research by Chang and Krosnick (2003) suggests asking about “typical behaviour” is more valid than asking about “past behaviour”, the interpretation of “typical day” may still vary depending on the respondent’s habits.
Step 2: Retrieving Information
Next, respondents must recall relevant memories. Should they think about specific recent drinking occasions? Should they carefully count the number of drinks they had last week and divide by seven? Or should they rely on general beliefs they hold about themselves, like “I’m not much of a drinker”?
Step 3: Forming a Tentative Judgement
Once they have gathered information, respondents must calculate an estimate. For example, they might average their drinks from the past week to form an answer.
Step 4: Choosing a Response
Now they must match their tentative judgement to the response options provided. This step brings additional challenges. For instance, what does “average” mean? How much is “somewhat more than average”? These terms are subjective and open to interpretation.
Step 5: Editing the Response
Finally, respondents may adjust their answer before reporting it. For example, someone who drinks heavily might hesitate to admit they drink “a lot more than average” and instead choose the less extreme option, “somewhat more than average”, to avoid judgment.
What seems like a simple question, “How much do you drink?”, actually involves a complex series of cognitive steps. Each step introduces potential sources of error, highlighting the importance of careful survey design to ensure clarity and reduce ambiguity.
Context Effects on Survey Responses
Survey responses can be unintentionally influenced by factors unrelated to the actual content of the questions. These influences, known as context effects, arise from the way questions are presented or the options provided (Schwarz & Strack, 1991).
One common context effect is the item-order effect, where the order of questions impacts how respondents answer. For example, in a study by Fritz Strack and colleagues (1988), college students were asked about their overall life satisfaction and their dating frequency. When the life satisfaction question was asked first, the correlation between the two answers was weak (−0.12). However, when the dating question came first, the correlation became strong (+0.66). This shift happened because answering the dating question first made dating frequency more prominent in the respondents’ minds, influencing how they rated their overall life satisfaction.
Another context effect comes from the response options provided (Schwarz, 1999). For example, when people are asked how often they feel “really irritated” and given options ranging from “less than once a year” to “more than once a month”, they tend to interpret the question as referring to major irritations and report being irritated less frequently. However, if the options range from “less than once a day” to “several times a month,” they focus on minor irritations and report being irritated more frequently.
Additionally, respondents often assume that middle response options represent what is normal or typical. For example, when asked about how much television they watch, people are more likely to report higher viewing times if the middle option is set at 4 hours rather than 2 hours.
To reduce these context effects, researchers can rotate or randomise the order of questions and response options, especially when no natural order exists. Online survey tools often allow for counterbalancing or randomisation, which helps minimise order effects. This practice is particularly important in contexts like political polls, where being listed first on a ballot has been shown to give candidates a 2.5% boost among undecided voters simply due to their position on the list (Miller & Krosnick, 1998).
Writing Survey Items
Types of Survey Items
Survey items generally fall into two categories: open-ended and closed-ended. Each type serves a specific purpose and has its strengths and limitations.
Open-Ended Items
Open-ended questions allow participants to respond freely without being constrained by preset options. Examples include:
- “What is the most important thing to teach children to prepare them for life?”
- “Please describe a time when you were discriminated against because of your age.”
- “Is there anything else you would like to tell us about?”
Open-ended questions are particularly useful when researchers are uncertain about the range of possible responses or want to avoid influencing participants’ answers. These questions are often employed in the early stages of research or when exploring qualitative insights.
While open-ended questions are relatively easy to write, they come with challenges:
- they require more time and effort from participants
- they are harder to analyse because responses must be transcribed, coded, and analysed qualitatively
- participants are more likely to skip open-ended questions because they require longer answers.
Open-ended items are most effective when the researchers are exploring unknown variables or when the data can later be categorised for analysis.
Closed-Ended Items
Closed-ended questions provide participants with a predefined set of response options. Examples include:
- “How old are you?”
- Under 18
- 18 to 34
- 35 to 49
- 50 to 70
- Over 70
- “On a scale of 0 (no pain at all) to 10 (worst pain ever experienced), how much pain are you in right now?”
- “Have you ever in your adult life been depressed for a period of 2 weeks or more?”
- Yes
- No.
Closed-ended questions are useful when researchers have a clear understanding of possible responses. They are typically used for quantitative analysis and are ideal for measuring specific variables or constructs, such as agreement levels, risk perceptions, or behavioural frequency.
While closed-ended questions are more difficult to write (due to the need for appropriate response options), they are:
- faster and easier for participants to answer
- simpler to analyse, as responses can be easily converted into numerical data and entered into statistical software.
Response Options in Closed-Ended Items
All closed-ended questions include response options designed to match the type of variable being measured. For categorical variables, such as gender or political party preference, participants select one or more applicable categories from a list. For quantitative variables, researchers commonly use rating scales, which present an ordered set of responses for participants to choose from.
Rating scales typically range from three to eleven points, with five-point and seven-point scales being the most popular. Five-point scales are best suited for unipolar questions, where only one dimension is being measured, such as frequency (Never, Rarely, Sometimes, Often, Always). In contrast, seven-point scales are ideal for bipolar questions, where responses fall along a spectrum with two opposing ends, such as liking (Like very much to Dislike very much).
To improve the accuracy of responses on bipolar scales, researchers often use a branching technique. For example, if asking about preferences for ice cream, the first question might be, “Do you generally like or dislike ice cream?” Based on the participant’s response, they would then be presented with the corresponding range of options from the seven-point scale. This approach improves both the reliability and validity of the responses, as demonstrated by research from Krosnick and Berent (1993).
When presenting rating scales, it is generally better to use verbal labels rather than numerical ones during data collection, though numerical values are still applied during analysis. Researchers should also avoid overly specific or partial labels, as these can confuse participants.
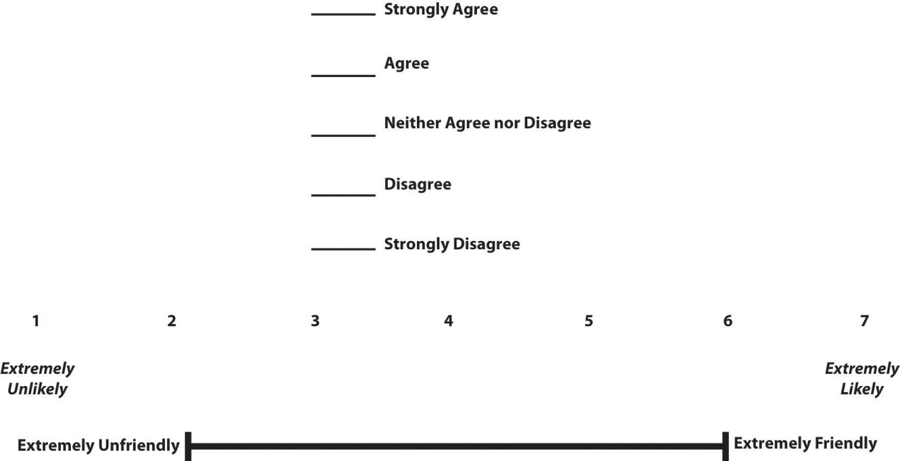
Another type of response option is the visual-analogue scale, such as the one shown in Figure 9.6.2, where participants mark a point along a horizontal line to indicate their response. These scales are particularly effective when paired with meaningful graphics that help clarify the intended meaning of the response options.
What is a Likert Scale?
A Likert scale is a specific type of rating scale commonly used in psychological research to measure people’s attitudes toward a person, group, or idea. Although the term is often misused to describe any rating scale (e.g., a 0-to-10 life satisfaction scale), it has a precise definition.
In the 1930s, researcher Rensis Likert (pronounced LICK-ert) developed this method to quantify attitudes. Participants are presented with a series of statements, both positive and negative, about a particular subject. They then indicate their level of agreement or disagreement with each statement using a 5-point scale:
- strongly agree
- agree
- neither agree nor disagree
- disagree
- strongly disagree.
Each response is assigned a numerical value, and these values are summed across all items to produce an overall score representing the individual’s attitude. For negatively worded statements, researchers use reverse coding to ensure consistency in scoring across all items.
It is important to note that a true Likert scale specifically measures attitudes using multiple statements rated on this 5-point agreement scale. If you are using a single-item rating scale or measuring something other than attitudes (e.g., frequency or satisfaction), it is more accurate to simply call it a rating scale rather than a Likert scale.
Writing Effective Survey Items
Creating effective survey questions is key to minimising confusion and maximising the reliability and accuracy of participants’ responses. The BRUSO model (Peterson, 2000) offers a helpful guideline for crafting strong survey items. BRUSO stands for Brief, Relevant, Unambiguous, Specific, and Objective.
Brief items are short and direct, avoiding unnecessary words or overly technical language. This makes them easier for participants to understand and quicker to answer. For example, instead of asking, “Are you now or have you ever been the possessor of a firearm?”, a better version would be “Have you ever owned a gun?”
Relevant items focus only on information directly related to the research question. Asking about a participant’s sexual orientation, marital status, or income should only be included if it is clearly necessary for the study. Irrelevant questions not only waste time but can also irritate respondents.
Unambiguous items leave no room for multiple interpretations. A question like “Are you a gun person?” is unclear, as respondents may have different interpretations of what being a “gun person” means. A clearer version would be “Do you currently own a gun?”
Specific items focus on a single, clear idea. Avoid double-barreled questions, which ask about two separate issues but allow only one answer. For example, “How much have you read about the new gun control measure and sales tax?” should be split into two separate questions about gun control and sales tax.
Objective items should not reveal the researcher’s bias or guide respondents toward a particular answer. Instead of asking, “How much do you support the new gun control measure?”, a more neutral option would be “What is your view of the new gun control measure?”
Response Options for Closed-Ended Items
For categorical variables, response options should be mutually exclusive and exhaustive.
- Mutually exclusive means the categories do not overlap. For example, “Protestant” and “Catholic” are mutually exclusive, but “Christian” and “Catholic” are not.
- Exhaustive means all possible answers are covered. If including every option is not feasible, an “Other” category with space for respondents to clarify their response can be used.
If respondents can belong to more than one category (e.g., race or ethnicity), they should be instructed to “Select all that apply”.
For rating scales, five or seven response options usually offer enough precision without overwhelming respondents. For more familiar dimensions, such as attractiveness, pain, or likelihood, a 0-to-10 scale can also work effectively.
Regardless of the number of response options, the scale should be balanced around a neutral midpoint. For example:
- Unbalanced Scale: Unlikely | Somewhat Likely | Likely | Very Likely | Extremely Likely
- Balanced Scale: Extremely Unlikely | Somewhat Unlikely | As Likely as Not | Somewhat Likely | Extremely Likely
Including a neutral midpoint is optional. Researchers sometimes omit it to encourage participants to make a definitive choice rather than defaulting to the middle. However, for bipolar scales (e.g., Agree-Disagree), a neutral midpoint can be helpful for those who genuinely feel neutral about the topic, such as that in Figure 9.6.3.
Formatting the Survey
Creating a well-organised survey goes beyond writing effective questions. The overall structure and presentation play a key role in ensuring respondents stay engaged and provide accurate answers.
Introduction:
Every survey should begin with a clear and engaging introduction that serves two main purposes. First, it should encourage participation. Unlike lab studies, where participants have already volunteered their time, survey respondents are often approached unexpectedly, such as through phone calls, emails, or mail. Researchers need to make a compelling case for why someone should take the time to respond. A strong introduction briefly explains the survey’s purpose and significance, identifies the sponsor (e.g., a university, which often improves response rates), highlights the importance of each respondent’s contribution, and mentions any incentives for participation.
Second, the introduction should establish informed consent. Respondents must understand the essential details before agreeing to participate. This includes the survey topics, estimated time commitment, confidentiality assurances, and the fact that they can withdraw at any time. While formal written consent forms are not always required in minimal-risk survey research, the introduction must still clearly communicate these points.
Instructions:
After the introduction, the survey should provide clear instructions for how to complete it. If the survey includes unusual response formats or rating scales, include simple examples to guide respondents. Clear instructions reduce confusion and improve data quality.
Order of Questions:
The order of the questions also matters. Respondents are typically most engaged and focused at the start of the survey, so begin with the most important questions, such as those that are directly tied to your research goals. Group similar items together; for example, keep questions using the same rating scale or focusing on a particular topic in one section. This approach makes it easier for respondents to follow and answer consistently.
Demographic Questions:
Save demographic questions (e.g., age, gender, income) for the end of the survey. These questions are generally less engaging but also quick and easy to answer, making them suitable for when respondents might be starting to feel fatigued.
A well-structured survey begins with a clear introduction, includes easy-to-follow instructions, presents important questions early, groups similar items together, saves demographics for the end, and finishes with a thank-you note.
References
Chang, L. and Krosnick, J. A. (2003). Measuring the frequency of regular behaviors: Comparing the “typical week” to the “past week”. Sociological Methodology, 33(55-80). https://doi.org/10.1111/j.0081-1750.2003.t01-1-00127.x
Converse, J. M. (2009). Survey research in the United States: Roots and emergence 1890-1960. Routledge.
Krosnick, J. A., & Berent, M. K. (1993). Comparisons of party identification and policy preferences: The impact of survey question format. American Journal of Political Science, 37(3), 941–964. https://doi.org/10.2307/2111580
Miller, J. M., & Krosnick, J. A. (1998). The impact of candidate name order on election outcomes. The Public Opinion Quarterly, 62(3), 291–330. http://www.jstor.org/stable/2749662
Peterson, R. A. (2000). Constructing effective questionnaires. Sage Publications.
Schwarz, N. (1999). Self-reports: How the questions shape the answers. American Psychologist, 54(2), 93–105. https://doi.org/10.1037/0003-066X.54.2.93
Schwarz, N., & Strack, F. (1991). Context effects in attitude surveys: Applying cognitive theory to social research. European Review of Social Psychology, 2(1), 31–50. https://doi.org/10.1080/14792779143000015
Strack, F., Martin, L. L. & Schwarz, N. (1988). Priming and communication: Social determinants of information use in judgments of life satisfaction. European Journal of Social Psychology, 18(429-442). https://doi.org/10.1002/ejsp.2420180505
Sudman, S., Bradburn, N. M., & Schwarz, N. (1996). Thinking about answers: The application of cognitive processes to survey methodology. Jossey-Bass.
Chapter Attribution
Content adapted, with editorial changes, from:
Research methods in psychology , (4th ed.), (2019) by R. S. Jhangiani et al., Kwantlen Polytechnic University, is used under a CC BY-NC-SA licence.
