1.9 Numeracy concepts for speech pathology
1.9.1 How do speech pathologists use numeracy skills in practice?
As speech pathologists, we need to be able to apply basic numeracy skills in our practice, including interpreting numerical data we use in speech pathology. These numeracy skills are underpinned in the Professional Standards for Speech Pathologists in Australia (SPA, 2020).
EXAMPLE 1
Let’s explore standard 3.2 (Assessment communication and swallowing needs) and the associated elements:
b. We use each contact with the individual and/or community to contribute to ongoing individual assessment or community needs assessment.
c. We assess and consider the communication and swallowing goals and needs of the individual and/or community with respect to:
- body structures and functions, and/or
- performance and capacity in activities and participation
- opportunities for prevention and promotion strategies and initiatives
- facilitators and barriers in the social and physical environment.
In these examples, we see a common theme of assessment and goals. These aspects require some form of data acquisition (i.e. numbers) to use as a baseline, for monitoring, and for collaborative development of measurable goals.
EXAMPLE 2
Let’s explore standard 3.3 (Interpret, diagnose and report on assessments) and the associated elements:
a. We use clinical reasoning to synthesise assessment findings and formulate a diagnosis or description.
b. We use evidence to inform our understanding of why a need exists and to identify factors that may contribute to possible outcomes.
In these examples, we see a common mathematical terms. We use measurement of individuals’ skills and relate these to typical performance or development. Evidence may be in the form of the data we acquire and data reported in scholarly literature. This helps us to describe and discuss the nature, severity and prognosis of the area/s of concern.
EXAMPLE 3
Let’s explore standard 3.4 (Plan speech pathology intervention or service response) and the associated elements:
a. We identify communication and/or swallowing intervention or service response options relevant to the identified goals.
b. We design an intervention or service response plan informed by a range of options.
c. We identify how intervention or service response outcomes will be measured.
d. We adjust plans over time informed by assessments, changing goals, current needs and outcomes of interventions or service responses.
In these examples, we see numerical data is related to all elements of service planning.
EXAMPLE 4
Let’s explore standard 3.5 (Implement and evaluate intervention or service response) and the associated elements:
a. We implement the agreed intervention or service response that is responsive to the capability and progress of the individual or community.
b. We collect, record, analyse and share data to evaluate:
- the fidelity of the intervention or service response
- the appropriateness of the goals, plans and approaches being used
- the progress towards and acquisition of individual and community goals
- the timing of and engagement with other services and supports as needed
- when the intervention or service response will be complete.
c. We continually refine goals and modify the implementation of the intervention or service response to meet the needs of the individual or community.
In these examples, we see numerical data is related to most elements of implementing and evaluating our service response.
The examples above highlight that speech pathologists use numeracy skills in a variety of ways to support their work, particularly when providing assessment and intervention services to individuals, families and communities. While speech pathologists’ primary focus is communication and swallowing disorders, numeracy skills play an important role in both diagnostic and therapeutic contexts.
Here are some further ways speech pathologists may use numeracy skills in their practice:
| Practice area | Relationship to speech pathology practice | Numeracy skills and application examples |
| Assessing communication skills using standardised assessment | Many standardised assessment used by speech pathologists incorporate numerical scores to quantify an individual’s skills. Speech pathologists need numeracy skills to accurately interpret these scores and make sense of assessment results. |
|
| Tracking progress over time | Speech pathologists often track patient progress using numerical data. |
|
| Intervention planning and goal setting | Measurable goals help to guide selection of intervention approaches and monitoring to ensure the effectiveness and efficacy of the approaches. |
|
| Time management and scheduling | Speech pathologists often work with tight schedules, managing multiple clients, therapy sessions, and documentation requirements. |
|
| Data collection for research or clinical trials | In clinical or research settings, speech pathologists collect data to evaluate the effectiveness of treatment strategies. |
|
| Swallowing and feeding assessment | For speech pathologists working with patients who have swallowing difficulties (dysphagia), numeracy is crucial for analysing the consistency and viscosity of foods and fluids, identifying safe swallow approaches, and analysing technology approaches. |
|
| Interpreting audiological data | Speech pathologists working with patients who have hearing impairments must understand audiological data. |
|
| Speech production and articulation | Some treatment techniques for speech disorders, particularly in children, involve exercises related to counting, syllables, or phonological patterns. |
|
| Financial management in practice settings | Speech pathologists in private practice or running clinics also apply numeracy skills in the business side of their work. |
|
| Analysing client behaviour in cognitive-communication therapy | In cases of brain injury or cognitive-communication disorders, speech pathologists may need numeracy skills to assess memory, attention, and problem-solving abilities. |
|
1.9.2 Examples of the application of numeracy skills to speech pathology practice
The following are examples of the application of numeracy skills to various aspects of speech pathology practice. This is not an exhaustive list, however provides you with examples of numeracy skills that will be the foundation of your future learning and practice.
The normal distribution curve
The normal distribution curve, also known as the Gaussian distribution or bell curve, is a statistical concept that represents the distribution of a set of data where most of the observations cluster around the mean (average), with fewer observations occurring as you move further away from the mean. It is symmetrical and bell-shaped, meaning the data is evenly distributed on either side of the mean.
For most common norm-referenced, standardised tests, the number of people tested is so large that the scores of the people taking it form a bell-shaped or “normal” curve when plotted on a graph. This fact allows us to measure a client’s performance against clients of the same age by taking the raw scores and translating them into standard or scaled scores and percentiles.
This video provides a good overview of the normative curve in relation to standardised assessments.
Standard Scores by Southeast Psych is licensed under CC BY 4.0
Key characteristics of the normal distribution curve include:
1. Symmetry
- The normal distribution curve is symmetrical around the mean, meaning the left and right halves are mirror images of each other. The mean, median, and mode all coincide at the centre of the curve.
2. Bell-Shaped
- The curve rises gradually to a peak at the mean and then tapers off on both sides. It’s highest at the mean and decreases as you move away from the mean in either direction.
3. The Mean, Median, and Mode Are Equal
- In a perfectly normal distribution, the mean, median, and mode are all the same and located at the centre of the distribution. This central point is where the peak of the curve occurs.
4. Standard Deviation and Spread
- The spread or width of the normal distribution is determined by the standard deviation (SD). The larger the standard deviation, the wider and flatter the bell curve becomes. The smaller the standard deviation, the narrower and steeper the curve.
5. 68-95-99.7 Rule (Empirical Rule)
- In a normal distribution:
- 68% of the data falls within one standard deviation (±1 SD) of the mean.
- 95% falls within two standard deviations (±2 SD).
- 99.7% falls within three standard deviations (±3 SD). This rule is useful for understanding the spread of data and predicting the likelihood of observing certain values.
6. Asymptotic Nature
- The tails of the normal distribution curve extend infinitely in both directions, but they never actually touch the horizontal axis. This means that extreme values (far from the mean) are always theoretically possible, though the likelihood of such extreme values diminishes as you move further from the centre.
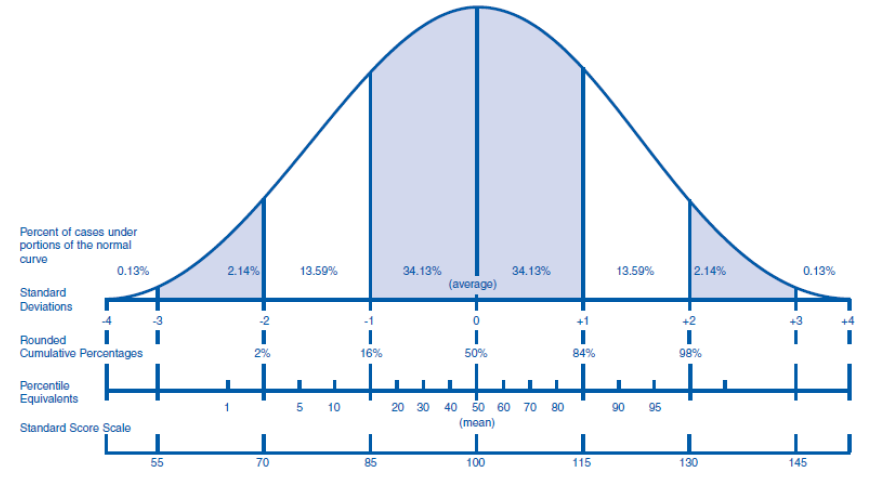
Figure 5 below shows a ‘perfect’ normal distribution. The peak of the curve represents Mean (or average) performance of the population from which data has been gathered. However, not every data point is the same as the mean, therefore we have data on the left (i.e. lower) and right (i.e. higher) of the mean. In the diagram below σ represents Standard Deviation, so 1σ equals one deviation and -1σ is the region of one standard deviation below the mean and 1σ is the region of one standard deviation above the mean. In a perfect normal distribution this means that approximately 70% (i.e. 68.2%) of population will fall within the 1 standard deviation range (i.e. 34.1 + 34.1) and approximately 95% (i.e. 95.2%) will fall within the 2 standard deviation range of the mean.
Standard scores and Percentiles
Standard scores and percentile equivalents are two ways of interpreting where an individual’s score or measurement falls in relation to a normative distribution, often represented by the normative distribution curve. They provide a way to understand an individual’s performance relative to the general population or a group of peers.
Standard scores are a type of z-score which expresses an individual’s performance in terms of how many standard deviations their score is above or below the mean of the distribution. Standard scores are useful because they standardise data across different tests or measurement scales, making it easier to compare individuals or groups. In some tests or assessments, raw scores are converted into standard scores using a different metric, such as the T-score (where the mean is typically 50, and the standard deviation is 10) or Stanine score (on a scale of 1 to 9). These are all derived from the same underlying concept of z-scores but with different scales or units.
A percentile indicates the percentage of scores that fall below a given score in a normative distribution. It tells you the relative position of an individual’s score compared to others. The percentile rank refers to where an individual’s score stands in relation to others (e.g., the 85th percentile means the individual scored higher than 85% of the comparison group). The percentile equivalent is the actual score that corresponds to a given percentile rank.
Interpretation:
- 50th percentile is the median, meaning the score is exactly in the middle of the distribution.
- 90th percentile means the score is higher than 90% of the scores in the group.
- 10th percentile means the score is higher than only 10% of the scores.
calculating a client’s chronological age
What is chronological age?
Chronological age is how old someone is in actual calendar time. This refers to the amount of time that has passed since their birth, measured in years, months, and days.
Why is calculating chronological age important?
Chronological age is a critical factor in helping speech pathologists assess, diagnose, and treat communication and swallowing disorders in ways that are developmentally and contextually appropriate for the individual.
Developmental Milestones: A person’s chronological age provides context for understanding developmental milestones in speech and language acquisition. For example, children typically reach certain speech and language milestones by specific ages (e.g., saying their first word at around 12 months, forming two-word phrases by 2 years, etc.). Knowing a child’s chronological age helps the speech pathologist assess whether their speech and language skills are on track for their developmental stage.
Assessment of Communication Disorders: Age-based norms are used to assess whether a person’s speech and language abilities are typical or delayed. If a child has difficulty with communication, their chronological age helps the speech pathologist compare their performance to standardised age-related norms in order to identify any delays or disorders. Additionally, for many standardised assessments, chronological age influences the item number of where you might start the assessment.
Treatment Planning: Chronological age is used to guide treatment approaches. For instance, younger children might benefit from play-based interventions, while older children or adults may require more structured techniques. Age can also inform a speech pathologist about what kind of communication skills are expected at a given stage, which in turn helps determine the most appropriate intervention strategies.
Differentiating Between Age-Related Challenges and Pathological Issues: As people age, certain speech and language changes are typical (e.g., some older adults may experience slight declines in memory or word-finding ability). Knowing a person’s chronological age helps distinguish between natural age-related changes and potential underlying disorders that might require therapy, such as speech or language problems due to neurological conditions.
Predicting Outcomes: Early intervention is often most effective when addressing speech and language disorders. By knowing a child’s chronological age, a speech pathologist can estimate the likelihood of success with different interventions, as younger individuals tend to show more rapid and significant improvement with appropriate therapy.
Cultural and Linguistic Considerations: The speech pathologist may also consider the chronological age in the context of cultural or linguistic backgrounds, as communication expectations can vary widely across different societies and languages. This ensures that the assessment and treatment plan are appropriate for the individual’s specific age and environment.
How do I calculate chronological age?
EXAMPLE 1
Simple calculations where the date, month and year of testing is more than the client’s birth date:
- Write down the year, month and day of assessment testing and the client’s birth date.
- Subtract the client’s birth date from the testing date (begin with the day, then the month, then the year).
- There is generally no need to report the client’s age in days, unless the client is very young (e.g. a newborn baby) where days since birth is important to record.
In this example, the client’s age is 3 years and 3 months (or 3;03).
| Year | Month | Day | |
| Test Date | 2024 | 03 | 19 |
| Birth Date | 2021 | 01 | 03 |
| Age | 3 | 2 | (16) |
More complex calculations where the date and/or month of testing is less than the client’s birth date (when the testing date and/or month is less that the client’s date and/or month of testing, borrowing of values is required).
EXAMPLE 2
The month of testing is less than the client’s birth month:
In this case, you need to borrow 1 year (12 months) from the year of the test and add this to the month in which the test occurred.
In this example, 1 year is subtracted from the year of the test and the associated 12 months is added to the month of the test. The value of the test date in months now increases from 3 months to 15 months (i.e. 12 months added to the original 3 months). This now makes the calculation of chronological age more straightforward.
The client’s age is 2 years and 7 months (or 2;07).
| Year | Month | Day | |
| Test Date | 19 | ||
| Birth Date | 2021 | 08 | 03 |
| Age | 2 | 7 |
EXAMPLE 3
The day of testing is less that the client’s day of birth.
In this case, you need to borrow one month (always use 30 days, regardless of the actual number of days in the month) from the month of the test and add this to the day of the test.
In this example, 1 month is subtracted from the test month and the associated 30 days is added to the test date day. The value of the test date day now increases from 10 days to 40 days (i.e. 30 days added to the original 10 days). This now makes the calculation of chronological age more straightforward.
This client’s recorded age is 3 years and 1 month (or 3;01).
| Year | Month | Day | |
| Test Date | 2024 | ||
| Birth Date | 2021 | 08 | 20 |
| Age | 3 | 1 |
EXAMPLE 4:
The month and day of testing are both less than the client’s birth month and day.
In this case, you need to borrow 1 month (30 days) from the month of testing and add this to the day of testing. Then subtract 1 year (12 months) from the year of the test and add this to the month of the test and borrow. Deal with the day column first.
In this example, 1 month* (30 days) must be subtracted from the test date month (by changing the number of months from 3 to 2), and added to the test date (changing the number of days from 19 to 49). Next, 1 year must be borrowed from the test date year and added to the test date month (changing the number of months from 2 to 14).
*When borrowing 1 month, add 30 days to the first number in the day column.
This now makes the calculation of chronological age more straightforward.
The client’s age is 2 years and 6 months (or 2;06).
| Year | Month | Day | |
| Test Date | |||
| Birth Date | 2021 | 08 | 30 |
| Age | 2 | 6 |
monitoring progress
A great way to visually represent data to monitor a client’s progress is by using charts, tables or graphs. These can show a visual representation of data over time showing the client’s progress in different areas. These approaches help to clearly illustrate to both the clinician and the client, trends in a client’s progress and makes it easier to communicate findings to others.
Below is an example of progress monitoring for the percentage of correct responses over multiple sessions using table format.
| Session | /s/ words attempted | /s/ correctly produced | % correct |
| Week 1: |
49 |
26 |
53% (53.1) |
| Week 2: |
54 |
35 |
65% (64.8) |
| Week 3: |
61 |
36 |
59% (59) |
| Week 4: |
68 |
44 |
65% (64.7) |
| Week 5: |
63 |
47 |
75% (74.6) |
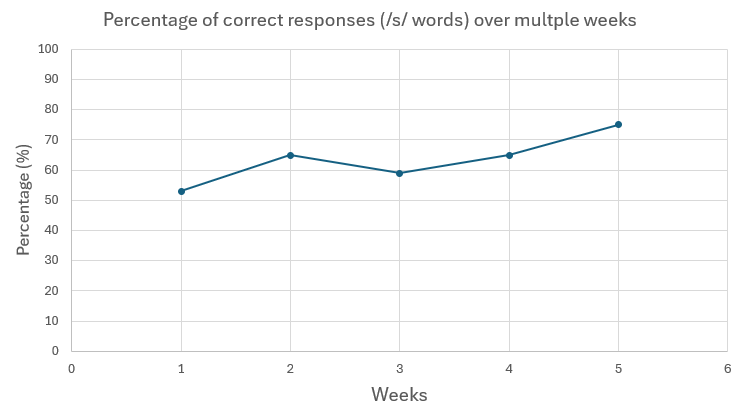
Figure 6 is an example of the same data using a graph format. Note how the graph provides a good visual representation of the data. Percent correct is on the y (vertical) axis; week is on the x (horizontal) axis.
Chronological age is how old someone is in actual calendar time. This refers to the amount of time that has passed since their birth, measured in years, months, and days.
