3.4 Sampling Techniques in Quantitative Research
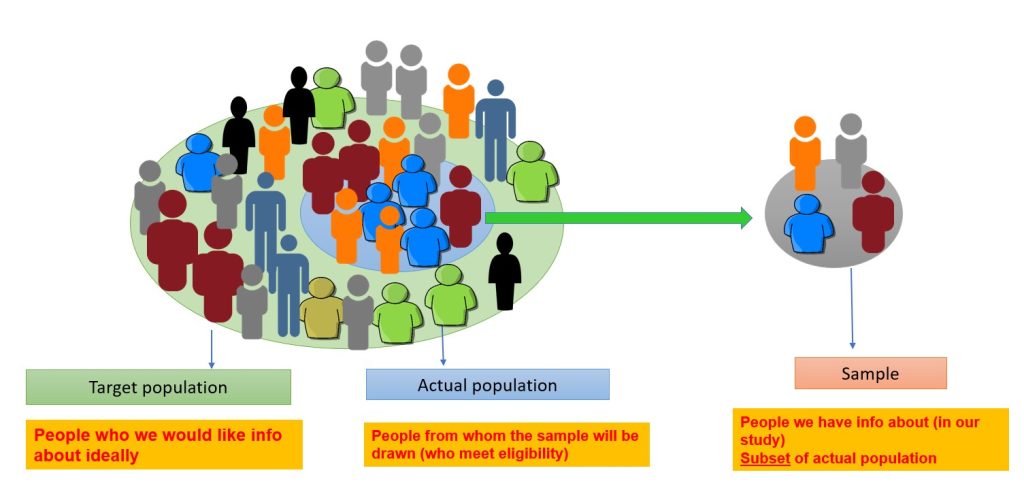
Target Population
The target population includes the people the researcher is interested in conducting the research and generalizing the findings on.40 For example, if certain researchers are interested in vaccine-preventable diseases in children five years and younger in Australia. The target population will be all children aged 0–5 years residing in Australia. The actual population is a subset of the target population from which the sample is drawn, e.g. children aged 0–5 years living in the capital cities in Australia. The sample is the people chosen for the study from the actual population (Figure 3.9). The sampling process involves choosing people, and it is distinct from the sample.40 In quantitative research, the sample must accurately reflect the target population, be free from bias in terms of selection, and be large enough to validate or reject the study hypothesis with statistical confidence and minimise random error.2
Sampling techniques
Sampling in quantitative research is a critical component that involves selecting a representative subset of individuals or cases from a larger population and often employs sampling techniques based on probability theory.41 The goal of sampling is to obtain a sample that is large enough and representative of the target population. Examples of probability sampling techniques include simple random sampling, stratified random sampling, systematic random sampling and cluster sampling (shown below).2 The key feature of probability techniques is that they involve randomization. There are two main characteristics of probability sampling. All individuals of a population are accessible to the researcher (theoretically), and there is an equal chance that each person in the population will be chosen to be part of the study sample.41 While quantitative research often uses sampling techniques based on probability theory, some non-probability techniques may occasionally be utilised in healthcare research.42 Non-probability sampling methods are commonly used in qualitative research. These include purposive, convenience, theoretical and snowballing and have been discussed in detail in chapter 4.
Sample size calculation
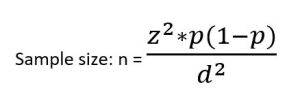
In order to enable comparisons with some level of established statistical confidence, quantitative research needs an acceptable sample size.2 The sample size is the most crucial factor for reliability (reproducibility) in quantitative research. It is important for a study to be powered – the likelihood of identifying a difference if it exists in reality.2 Small sample-sized studies are more likely to be underpowered, and results from small samples are more likely to be prone to random error.2 The formula for sample size calculation varies with the study design and the research hypothesis.2 There are numerous formulae for sample size calculations, but such details are beyond the scope of this book. For further readings, please consult the biostatistics textbook by Hirsch RP, 2021.43 However, we will introduce a simple formula for calculating sample size for cross-sectional studies with prevalence as the outcome.2
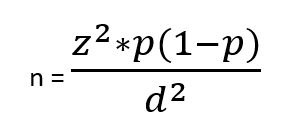
z is the statistical confidence; therefore, z = 1.96 translates to 95% confidence; z = 1.68 translates to 90%
confidence
p = Expected prevalence (of health condition of interest)
d = Describes intended precision; d = 0.1 means that the estimate falls +/-10 percentage points of true prevalence with the considered confidence. (e.g. for a prevalence of 40% (0.4), if d=.1, then the estimate will fall between 30% and 50% (0.3 to 0.5).
Example: A district medical officer seeks to estimate the proportion of children in the district receiving appropriate childhood vaccinations. Assuming a simple random sample of a community is to be selected, how many children must be studied if the resulting estimate is to fall within 10% of the true proportion with 95% confidence? It is expected that approximately 50% of the children receive vaccinations
z = 1.96 (95% confidence)
d = 10% = 10/ 100 = 0.1 (estimate to fall within 10%)
p = 50% = 50/ 100 = 0.5
Now we can enter the values into the formula

Given that people cannot be reported in decimal points, it is important to round up to the nearest whole number.
