3.5 Avoiding Errors in Quantitative Research
Quantitative researchers must assess the internal validity of the study’s findings (whether the observed findings are true). A study is only deemed valid when the following three alternative explanations (major errors) have been ruled out – random error, bias and confounding. 37
- Random error: The likelihood that the observed result is due to chance, an uncontrollable force with no discernible source. 37 Random error arises from measurement error and sampling variability. Random error mainly affects precision, which is how reproducible the same measurement is under equivalent circumstances. 37 To explain this concept, let’s assume that a researcher aims to estimate smoking prevalence among students in a particular high school (See Figure 3.10 below). The researcher recruits an initial sample of eight (8) students. Of these eight students, three admit smoking cigarettes – therefore, smoking prevalence is 3/8 = 37.5%. If the researcher decides to repeat the study in the same high school, recruiting another set of eight students, if this following sample has five smokers, smoking prevalence will be 5/8 = 62.5%. When based on a sample of n = 8, sample-to-sample variability is high and this is referred to as random sampling error.
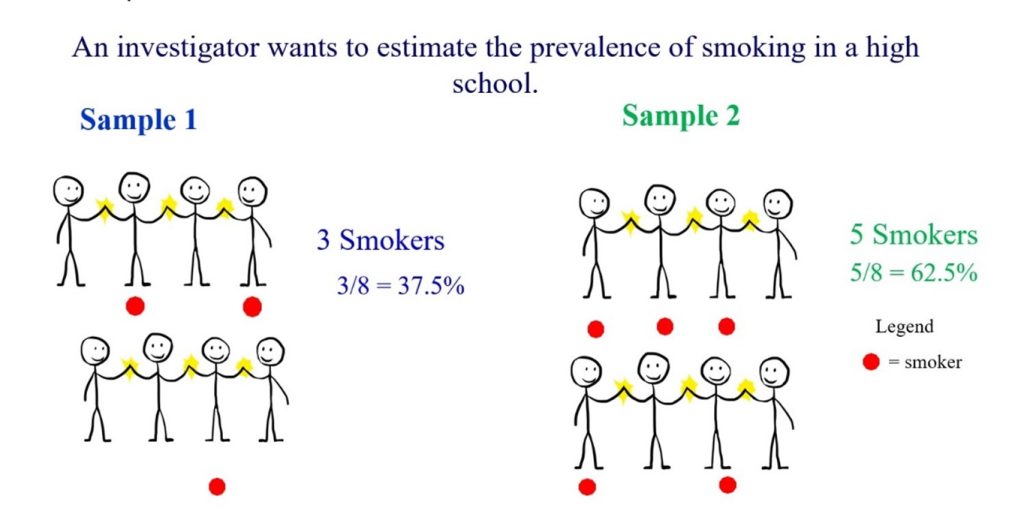
Figure 3.10 Random error- estimating smoking prevalence among eight students by Bunmi Malau-Aduli and Faith Alele, used under a CC BY NC 4.0 licence However, as shown in Figure 3.11, the amount of random error in a sample will reduce if the sample size is increased. If the study is conducted with 100 students, and 30 students identify as smokers, this will yield a prevalence of 30%. If another sample of 100 students is recruited again, with 35 smokers, the prevalence will be 35%.
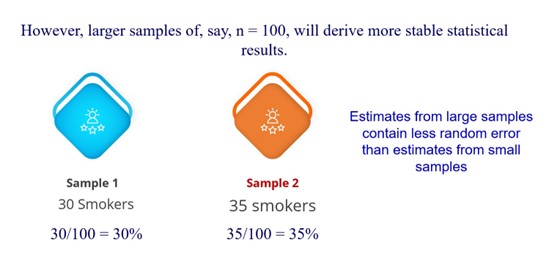
Figure 3.11 Random error- estimating smoking prevalence among 100 students by Bunmi Malau-Aduli and Faith Alele, used under a CC BY NC 4.0 licence - Bias: This is a systematic error in the design or conduct of a study that results in an erroneous association between exposure and outcome; it is impossible to avoid by increasing sample size. 2 Systematic error arises when the findings deviate from the real values in a systematic manner. The two forms of bias are selection bias and measurement bias. Selection bias occurs when individuals or groups in a study differ systematically from the population of interest leading to a systematic error in an association or outcome. 2 Examples of selection bias are volunteer bias, poor response rate, loss to follow-up (‘survival’), unhealthy worker impact, and detection bias (medically relevant exposure leads to closer surveillance for study results, which may result in a bias). 2 Bias in the way information is obtained is defined as measurement bias, and it is also referred to as observation or information bias. 37 Measurement bias occurs while measuring or categorising the exposure, the outcome, or both. Examples of measurement bias include record abstracting error, recollection bias, interviewer/observer bias, digital bias (preferring specific numbers), placebo effect, and Hawthorne effect (individuals modifying an aspect of their behaviour in response to their awareness of being observed). 2, 37
- Confounding: A confounder is a variable that mixes or muddles the effect or distorts the association between the dependent and independent variables, causing a spurious association. 2, 37 These three conditions must be fulfilled for a variable to be classified as a confounder. A confounder must be associated with the outcome, must be associated with the exposure and must not lie on the causal pathway between an exposure and outcome. 2, 37 Some common confounders include age, gender, socioeconomic status and smoking. 2, 37 For example, researchers are interested in the association between alcohol and mortality. The researchers found out that those who consumed more alcohol were more likely to die. However, the researchers have not considered variables like age, gender, smoking and diet. These variables are also known to be associated with both alcohol and mortality. For example, those who consume alcohol less are more likely to eat healthier or are less likely to smoke.
