5.6 Triangulation of Data
Triangulation in mixed methods research is also known as the integration of data. It refers to the process of using multiple methods, data sources, or perspectives to gain a more comprehensive understanding of a research problem.31,32 Mixed methods research involves triangulating the same phenomenon using different data collection methods (e.g. surveys and interviews) or different data sources (e.g. self-reported data and observed data).32 In mixed methods studies, researchers methodically integrate or blend quantitative and qualitative data to maximise the strengths and minimise the flaws of each technique.32 Triangulation can be used to validate and reinforce the research results by providing multiple perspectives on the same phenomenon and identifying areas of discrepancies or complexities.31,32 This can help identify and explain biases and increase the validity of the study findings.31,32 For example, suppose a researcher wishes to study the impact of a new educational program on student performance. In that case, surveys may be used to collect quantitative data on student performance, and interviews may be used to obtain qualitative data on student perceptions of the program. The researcher can then triangulate the data by comparing and contrasting survey data on student performance with interview data on student perceptions. This would help provide a more comprehensive understanding of the program’s impact on student performance. Specific techniques for integrating qualitative and quantitative research procedures and data exist. Data integration could occur at the design, methods, interpretation and reporting levels.33
Integration at the Design Level
The basic and advanced mixed methods designs can be used to integrate at the design level or conceptualisation stage of the research. As stated above, the basic designs include convergent, exploratory sequential and explanatory sequential design. In sequential designs, the findings of one technique are used to build the other method or phase. In contrast, convergent designs aim to combine the phases so that the quantitative and qualitative results may be compared.34
Integration at the Methods level
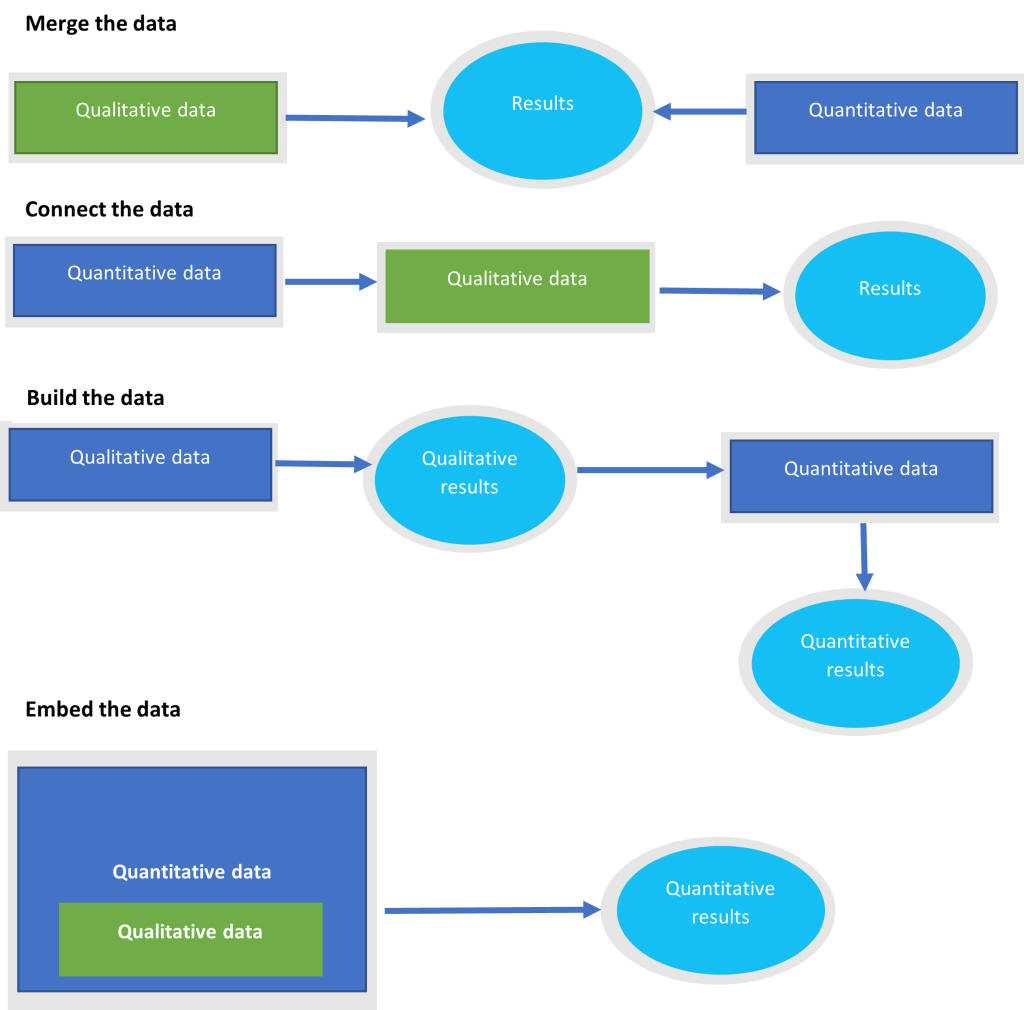
Method level integration commonly relates to the type of design used in a study. Creswell and Plano Clark conceptualize integration to occur by linking data collection and analysis.32 Linking occurs in several ways: (1) merging; (2) connecting; (3) building; and (4) embedding (Figure 5.7). In a single line of inquiry, integration may occur through one or more of these approaches.32 For example, connecting follows naturally in sequential designs, while merging can occur in any design. Embedding generally occurs in an interventional design. Thus, the design sets parameters for what methodological integration choices can be made.
Merging: Integration through data merging occurs when researchers bring the two databases together for analysis and comparison. Merging of data typically occurs after the statistical analysis of the numerical data and qualitative analysis of the textual data. This type of integration consists of combining the qualitative and quantitative data by reporting results in a discussion section of study.35 The reporting could start with the quantitative statistical results and subsequently incorporate the identified themes and qualitative quotes to support or refute the quantitative results. It also can be achieved by transforming the qualitative themes into quantifiable results (content analysis), which can be compared with the quantitative dataset.36 Tables or figures that portray both the quantitative and the qualitative results can also be used to present the integration.34
Connecting: Integration through connecting occurs when one type of data connects with the other data via the sampling frame. Whether the design is sequential or convergent, connecting can occur through sampling.34 For example, a study can include a survey and qualitative interviews and participants for the interviews are drawn from the population of survey respondents.34 This integration entails analysing one dataset, such as the quantitative survey, and then utilising the results to inform subsequent data gathering for the qualitative part (e.g., interview questions and identification of participants to interview).34 By linking the analysis of the quantitative phase’s results with the qualitative phase’s data gathering, the integration is accomplished in this way.34
Building: Integration via building entails using results from one data collection procedure to guide another data collection strategy. Survey items can be developed using findings from qualitative data previously gathered that provide hypotheses or identify constructs or language used by study participants.34 For example, Jafer et al., 2020 used themes from the qualitative interview to develop a quantitative survey tool that incorporated the three main themes from the qualitative study.27
Embedding: Integration through embedding occurs when data collection and analysis are linked at several points and is crucial in advanced interventional designs. The characteristic of embedding is repeatedly connecting qualitative data to quantitative data at multiple points. Embedding may occur during the pretrial phase, when qualitative (or a combination of qualitative and quantitative) data can be used in various ways, such as developing trial-specific measurement tools, clarifying outcome measures, and understanding contextual factors that may cause bias.34 Qualitative data collection throughout the trial can be utilised to comprehend contextual aspects that may have an impact on the trial outcomes or offer in-depth details on the nature of the experience of the participants. In addition, post-trial qualitative data gathering can be used to establish hypotheses regarding adjustments that could be required for general adoption outside of a controlled research setting, explain outliers, or debrief subjects or researchers about events or experiences that occurred during the experiment.34
Integration at the Interpretation and Reporting Level
Three methods are used to integrate qualitative and quantitative data at the interpretation and reporting levels: (1) narrative integration; (2) data transformation integration; and (3) joint displays integration.34
Integration through narrative: Researchers use narratives to describe the quantitative and qualitative data findings. This approach allows for a more holistic understanding of the research question and can provide a more comprehensive view of the phenomenon being studied.34 There are three techniques for narrative integration in research papers. In the contiguous approach, the results are presented in a single report using the contiguous method of integration, although the qualitative and quantitative findings are presented in various parts.34 The weaving approach entails writing qualitative and quantitative results together theme by theme or concept by concept in one report or a series of reports. The staged approach to integration frequently occurs in multiphase mixed method research when each phase’s conclusions are presented in stages as the data are evaluated and published independently.34
Integration through data transformation: Two phases are involved in integration through data transformation. One type of data must first be transformed into a different kind of data (i.e., qualitative into quantitative or quantitative into qualitative).34 The modified data are combined with the raw data in the second step. In mixed methods, data transformation refers to using content analysis to convert qualitative data into numeric counts and variables so that the data may be merged with a quantitative database. Refer to Chapter 4 for details on content analysis.34
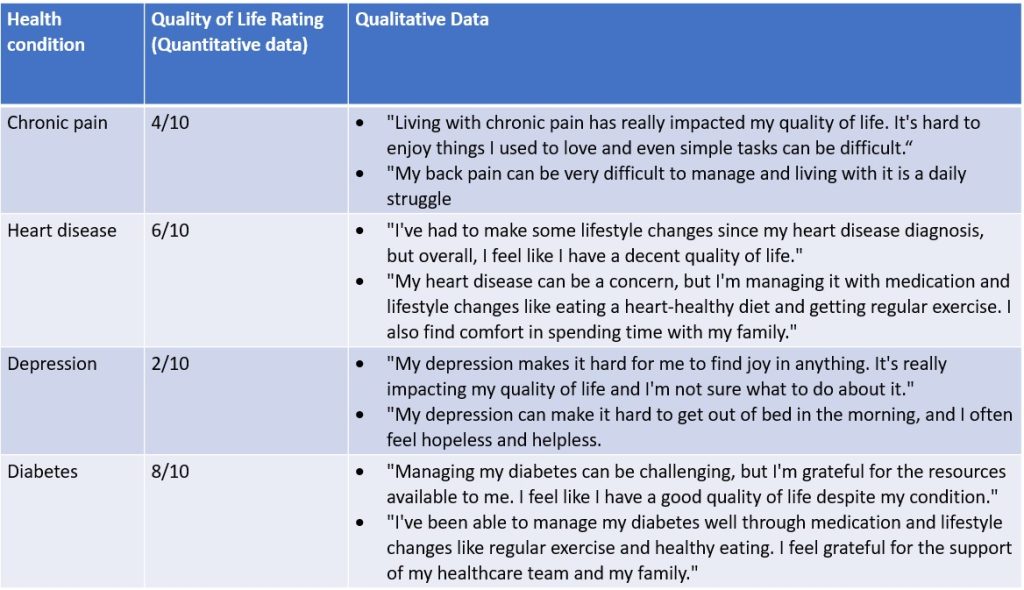
Joint display integration: To obtain fresh insights beyond those obtained from the individual quantitative and qualitative results, researchers may integrate their data by presenting both findings together using data visualisation techniques. Related data can be presented as a figure, table, matrix, or graph.34 For example, a group of researchers sought to assess and explore the impact of four chronic diseases on patients’ quality of life (QoL) using both quantitative and qualitative research methods. Patients’ self-reported quality of life was obtained via a survey, while their perceptions of the impact of the diseases were sought via individual interviews. The joint display integration of both quantitative and qualitative findings is presented in Table 5.1 below. In the table, the first column displays the chronic health conditions under investigation, the second column displays patients’ self-reported quality of life ratings on a scale of 1 to 10, and the third column displays qualitative data related to patients’ experiences of chronic health conditions.
Table 5.1: An example of a joint display integration of both quantitative and qualitative findings
Rigour and trustworthiness
In mixed methods research, rigour and trustworthiness are crucial factors to take into account since they relate to the quality and credibility of the research study.37 Rigour refers to the degree to which a study is conducted in a systematic, thorough, and accurate way. In comparison, trustworthiness is the degree to which the findings of a study can be trusted to be credible, authentic, and dependable. Ensuring rigour in mixed methods research involves paying attention to the design of the study, the sampling plan, the data collection methods, and the data analysis methods.38 On the other hand, trustworthiness is established by assessing the transparency of the research process, the credibility of the data and the conclusions, and the dependability and confirmability of the findings.37 However, establishing rigour and trustworthiness in mixed methods research is challenging due to the discrepancies between evaluating quantitative and qualitative procedures. In quantitative research, the study needs to be internally valid and reliable to be generalizable. On the other hand, credibility, transferability, dependability, and confirmability characteristics are regarded as the “gold standard” in qualitative research. Researchers must increase the reporting of quantitative and qualitative data rigour to assess the quality of mixed methods studies and their outcomes.38 Further details on these concepts are provided in chapters 3 and 4.
An example of how rigour can be achieved is presented in the sequential explanatory mixed methods study conducted by Albert et al. 28 To ensure rigour and trustworthiness, the authors used several strategies. For the survey, they conducted a pilot study to test the survey questions and ensure their validity and reliability. They also used a convenience sampling method and provided information sheets with clear instructions about the research to the participants. For the interviews, the authors purposively selected a heterogeneous mix of participants based on their survey responses. Furthermore, the authors used multiple sources of data (interviews and survey responses) to triangulate the research findings, and they conducted member checking to ensure the accuracy of the data.
